Category Archives: Database Admin

Reducing SQL2000 to SQL2014 DB Migration Outages

Say you’re making a big jump and upgrading a database from SQL 2000 to SQL 2014. Of course it only makes sense that this will be a side-by-side upgrade and therefore you’ll need a plan to migrate your DB from the SQL2000 box to the SQL2014 box. SQL2014 won’t allow a restore or attach of a SQL2000 DB. SQL2014 only allows restore or attach of SQL2008 DBs and later. So we need a 2-hop migration plan – here’s a “you get the general idea” sketch of the plan:

  1. disconnect DB connections – outage begins
  2. backup the SQL 2000 DB
  3. copy the backup to the SQL2008 server
  4. hop 1- restore the DB to the SQL2008 instance
  5. backup the SQL 2008 DB
  6. copy the backup to the SQL2014 server
  7. hop 2 – restore the DB to the SQL2014 instance
  8. redirect DB connections & etc. – outage ends

The good news for our 2-hop plan is the intermediate SQL2008 instance need not be production caliber any way – it’s a just a  temporary stop-over on the way to update the DB so we can restore it to SQL2014. The bad news is, this 2-hop plan complicates the migration plan and extends the potential outage as we copy\paste database backups or data files over the network between the three servers.

But there is a way to simplify the plan and minimize the outage. Let’s try this:

  1. disconnect DB connections – outage begins
  2. detach the SQL 2000 DB
  3. copy the database files to the SQL2014 server
  4. hop 1- attach the DB to the SQL2008 instance
  5. detach the SQL SQL2008 DB
  6. hop 2 – attach the DB to the SQL2014 instance
  7. redirect DB connections & etc. – outage ends

We’re using detach\attach here rather than backup\restore but that’s not too important – things would work out fine either way. The thing to notice is that we lost a step and – more importantly – gained back the time it takes to “6. copy the backup to the SQL2014 server”. We only need one copy operation – from the SQL2000 server direct to the target SQL2014 server. Depending on DB size, network speeds and copy methods, that might be a lot of time saved.

How can this work? Because SQL2008r2 (and SQL 2008 with -T1807) allows the database file path to be a UNC – i.e. in this case a file share to the DB files on the SQL2014 server.
So, the hop 1 (step 6 above) might look something like this:

USE master;

GO

CREATE DATABASE MyAdventureWorks

ON (FILENAME = '\\SQLServer2014\MySQLServer\AdventureWorks2012_Data.mdf'),

(FILENAME = '\\SQLServer2014\MySQLServer\AdventureWorks2012_Log.ldf')

FOR ATTACH;

GO

Read up on it here: Description of support for network database files in SQL Server.

This sketch is skimming over quite a few other considerations so be sure think through all the other migration do-s and don’t-s (some more ideas here if you like). And don’t forget to clean up that file share once the migration is complete. Happy (migration) trails to you! 😐

Balancing SQL Server Min and Max Memory on an Active\Active Cluster

Consider a 2-node cluster with 7 instances. Each node has 8CPU (logical) and 64GB of RAM. It’s a (so-called) active\active configuration.  Two of the instances are especially high-resource-use and are segregated to their preferred node. The other instances are relatively quiet, using minimal CPU and RAM, and are split-up 2 and 3 to their preferred nodes.

This is what I’m working with recently and I decided to write up a quick post on apportioning memory to these clustered instances.

To start, when I came on the scene, min and max memory for each instance was configured as if all the instances shared a single server (node).

Pref. Node Instance  Min Mem Max Mem
A SQL1  0 16384
B SQL2  0 12288
A SQL3  0 4096
A SQL4  0 4096
B SQL5  0 4096
B SQL6  0 2048
B SQL7  0 2048

Total RAM dedicated to SQL instances cluster-wide here is 45GB leaving plenty of head-room even when all instances are running on one node.

That is ok and it certainly ensures if (in the case of an unplanned outage) or when (in the case of a planned outage) all instances fail over to a single node, there will be enough RAM to go around for each instance. But, in the day-to-day preferred configuration, with one high-use instance on each node, that leaves many GB of RAM unused (and un-usable per the max memory setting).

So I want to re-apportion memory among the instances for the typical, day-to-day operating configuration and give more of that unused RAM to our two high-use instances.

I start by understanding there will be times when all instances will run on a single node. When that occurs, how much of the total RAM should SQL use? In this case I’d like to leave ~14 GB to the OS and other, non-sql engine processes. So that leaves me with 50GB for the SQL servers and a question of how to split it up among the instances.

This is where a multi-server query comes in handy. If you create a local server group in SSMS (or use a central server) to include all the clustered instances and run a query against them, you can begin to get a sense of which instances will need more memory and which will need less. Here is a query I use as a mulit-server query to capture a snapshot of each instance’s minimum and maximum memory configuration, total and target memory usage, and PLE.

;with cte as (
select @@SERVERNAME as 'Instancename',
max(case when name = 'min server memory (MB)' then value_in_use end) as 'MinServerMemoryMB',
max(case when name = 'max server memory (MB)' then value_in_use end) as 'MaxServerMemoryMB'
from sys.configurations)
select p.Instancename,
os.PhysicalCPUCount,
os.PhysicalMemoryMB,
c.MinServerMemoryMB,
c.MaxServerMemoryMB,
p.TargetServerMemoryKB/1024 as 'TargetServerMemoryMB',
p.TotalServerMemoryKB/1024 as 'TotalServerMemoryMB',
p.PLE ,
(p.TotalServerMemoryKB)/p.PLE as 'ChurnKB/sec'
from(
select @@SERVERNAME as 'Instancename',
max(case when counter_name = 'Target Server Memory (KB)' then cntr_value end) as 'TargetServerMemoryKB',
max(case when counter_name = 'Total Server Memory (KB)' then cntr_value end) as 'TotalServerMemoryKB',
max(case when counter_name = 'Page life expectancy' then cntr_value end) as 'PLE'
from sys.dm_os_performance_counters)
as p
join cte c on p.instancename = c.instancename
join
(SELECT @@SERVERNAME as 'Instancename',
cpu_count AS 'LogicalCPUCount',
hyperthread_ratio AS 'HyperthreadRatio',
cpu_count/hyperthread_ratio AS 'PhysicalCPUCount',
physical_memory_in_bytes/1048576 AS 'PhysicalMemoryMB'
FROM sys.dm_os_sys_info ) as os
on c.instancename=os.instancename

By analyzing total vs target and PLE counters I can start to generalize where the majority of the RAM should go and how to divvy it up. Once I get that figured out I can make the changes to the minimum memory configuration. Minimum because, remember, this is solving for the situation where all instances have failed over to one node. If we set minimum for each instance that leaves some RAM for the OS and etc. but also enforces the instances share the 50GB,

Turning now to the maximum memory configuration and considering day-to-day active\active usage, I can now give my high-use instances a big chunk of RAM since, once they are on their preferred node, they don’t have to share memory. Here is how it looks:

Pref. Node Instance  Min Mem Max Mem
A SQL1 20480 41984
B SQL2 22528 44032
A SQL3 2048 4096
A SQL4 2048 4096
B SQL5 1024 2048
B SQL6 1024 2048
B SQL7 1024 2048

if you add it up, total minimum memory is 50GB (50176MB). This is what each instance gets – guaranteed (some exceptions apply 😉 ) – when everything is running on one node. As for max memory, note that memory total for each node adds up to 50GB. So, in active\active mode the SQL servers are able to utilize close to the available RAM (50 of the 64GB) and thereby improve performance.

This all works out fine for any variation of a fail-over –  either the whole cluster, or just for specific sql services moving around. Of course, the only ideal situation is when each instance is on it’s preferred node since that is what we just configured for… Any other arrangement should be considered temporary.

If you have more than one NUMA node you may need to tweak the query above. Read-up on SQL Skills take on PLE per NUMA nodes here  (which also links to the source of the idea behind the ‘churn’ metric in the query). One last thing, changing max and min memory settings clears the procedure cache. Be careful out there.

I’ve got a blank space baby… and it is filled in by my ConfigurationFile.ini

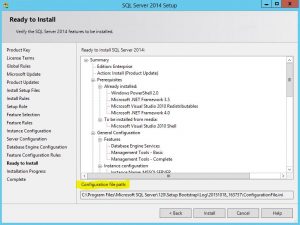
Check this out – the almost last page of a SQL install, Ready to Install. See the configuration file path at the bottom?

config-file-path

Recently I have been doing many SQL installs on Azure VMs. As AOAG ‘nodes’, each install needs to be, basically, the same. There are options for imaging Azure VMs but in this case I don’t have access to the portal. As a time saver I have been using these configuration files.

As I complete the first install with everything set up as required, I copy the configuration file path and then kick off the install. I paste that path into Windows Explorer which opens the .ini file — select all and copy. Next I move to my secondary, or secondaries, and quickly create a new text file on the desktop, paste, and save.

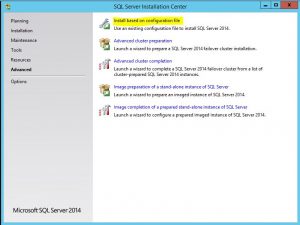
When I fire up the install-able on the secondary, I don’t go to ‘Installation’ as usual, instead I go to ‘Advanced’ and choose ‘Install based on a configuration file’.

capture

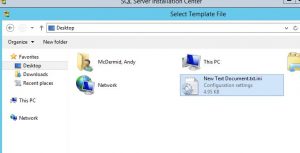
Now I have the chance to browse to the .ini config file on the desktop (kinda PITA that it has to be an .ini).

browse-to-template-file

Once that loads I’m off and clicking! Next, next, next, next, next, next, next with Taylor Swift tunes  echoing through the catacombs of my mind. Where necessary, I still need to input passwords, but otherwise all the “blank spaces” are filled in;  feature selections, root directory, shared feature directory, server and engine configuration (e.g. data directories), and so on.

No big deal, but a bit of a time saver when I want a set of SQL Servers to ‘match’ and it helps me to avoid one-off mis-configurations.


Proto-DBAs – Our Proud Heritage

Take a second to consider this amazing time we live and work in. We are tech pros and we are riding this huge historical wave of the information revolution. This revolution is not even close to over, we are somewhere in the middle of it all and who knows how far it will take us. But one could say it all started somewhere around the invention of the telegraph. As DBAs, perhaps we can point to our own little stripe of the revolution beginning with Dr. Cobb’s renown RDBMS paper. Somewhere there along the line after that, and after data became a ‘thing’, the DBA profession grew from necessity and progressed into what we do today.

But I’m here to say the DBA type has been around long before IT and data and the need to manage and secure data. Somebody has always been there, working diligently, keeping things running smoothly; sometimes completely behind the scenes but also sometimes as supporting actors in classic situation comedies.

Folks, these are the for-bearers of our esteemed profession. These are the proto-DBAs we have evolved from. Let’s take a look at a few prime examples of our proud legacy.

Goober

gooberThat beanie, that smile, the pocket full of pens and gauges … this guy is capital D.B.A. personified. Way before anyone was tuning stored procedures, Goober was keeping the squad cars running like a scalded dog and making sure Aunt Bee’s Hudson made it to the market and back. Once, he disassembled Gilly Walker’s car and rebuilt it —from the ground up — in the court house! Talk about skillz!  Reminds me of that one time I did that thing with transactional replication… Goober and his fellow proto-DBA cousin Gomer kept the gasoline and commerce flowing in Mayberry, NC. Bonus: he speaks truth to power!


Cooter

cooter

Another genius mechanic from the deep south, them Duke boys could always count on “Crazy Cooter”. Fast-forward 30 years, drop this guy in DT Hotlanta, and people would instinctively know – That guy is a DBA. General Lee draggin’ it’s tail? Cooter can fix it. Meanwhile y’all can borrow his super-charged El Camino. Now tha’s some high availability I tell you what. What’s that, chasing Boss Hog’s counterfeiting thugs and now the El Caminos crashed? Shooooot, proto-DBA Cooter’s got you bacccccccckeeeed-up. Use his super-charged 1971 Chevy pickup. It ain’t pretty, but you’ll still outrun Roscoe P. Coaltrain… queue-queue-queue.

Schneider

Never without his tool belt, Dwayne Schneider is there for you anytime day or schniedernight, all you have to do is call or page or email or text or skype or IM him. He’s not in his office – he’s waiting just outside your cube. He can fix anything, he can fix everything. One day at a time. And on that key chain there… he has the master key!


Ol’ Lonely

ollonley

Do you have your responsibilities at your shop just so totally dialed that you find yourself whiling away long afternoons staring into the screen like Ol’ Lonely here? Me either. But this proto-DBA and his super reliable Maytag washing machines is setting the example for all of us on how it’s done — I hope you are never lonely but let us all aspire to this level of greatness.


Maybe you are thinking – hey, you missed the professor from Gilligan’s Island, My Favorite Martian, and Wally Cleaver. No, those are examples of  proto-developers. I hope that clarifies things a little.


Who are your favorite proto-DBAs?


About the author: Drawn to database work since discovering the SQL language uses all caps, for related reasons, Andrew is now learning MongoDB administration.

What would a perfect SQL Server health check report look like?

Here’s a brain-storm wish list of my dream sql health check (Did I really just say that? Dream sql health check? I did, didn’t I. That’s it, I’m knocking off early for a pint).

—————————————————————–

Useful for a DBA – minimum of unnecessary information, focus on actionable items, pinpoints issues to improve health

Deliverable to other DBA or interested party – focus on showing steady improvement or consistently high overall health. Should be explainable, organized, professional, comprehensive, readable and understandable. Should satisfy – to some degree – typical audit requirements.

Quantifies health (e.g. 60%, B-, 5/10). The health quantification should be meaningful and easily explainable.

Illustrates trends in overall health over time

Leverages post SQL2008 out-of-box ‘health’ features – system health extended events and ring buffers, policy based management.

Centralized collection (w\option for single instance runs)

Customizable:

  • Include some functionality that examines policies in the Policy Based Management for specific categories of policies and reports on them.
  • Include some functionality that examines jobs for a specific category that would indicate a custom maintenance job and possibly prioritize them in the report.

Configurable:

  • Allows exclusion of some checks, but this idea can be expanded on so that – for instance – a daily health check is executed for just the backup section of the report. Via a SSRS subscription or db_mail this backup report would be emailed to the DBA team and\or the DB owner for morning review. This could be helpful solution for a number of different frequently requested reports – index frag, disk space, ect.
  • Incorporate an ‘.ini’ configuration file for each instance (could be txt or xml) to keep ideal configurations. Initially the ini file contains best-practice\default values, but the DBA either brings the instance in line with the best-practice\default values or – in case of exceptions – edits the ini file to match the instance settings. In this way the overall health visibly improves.

There are three categories health check info falls into. A report could be organized according to these categories and with sub heading for server, instance, database, table levels ….

  1. Informational
  2. Configurations
  3. Health

And here’s a list of what could be included in each category.

Informational:

  1. Overall Heath Rating\Grade
  2. OS Version and Service Pack
  3. Is Physical \ Virtual
  4. Clustered
    • Nodes ect
  5. CPU (make\model, speed, platform (32\64bit)
  6. RAM
  7. Disk
  8. Uptime
  9. Description of use e.g. “sharepoint server”, “backend of web, critical”
  10. ServerName\InstanceName
    • Version
    • Edition
    • SP
    • CUP
    • Global Trace Flags
  11. Logical CPUs
  12. Memory
    • Min \ Max
    • Total Server Memory \ Target Server Memory
    • PLE Snapshot
    • Is AWE?
  13. MDOP
  14. CTHFP

Configurations:

Server

  1. VAS =
  2. SQL Service has lock pages in memory?
  3. SQL Service account instance file initialization?

Instance

  1. SQL Service account
  2. PBM enabled\configured
  3. Data Collector enabled\configured
  4. Resoure Gov enabled\configured Login trigger?
  5. Database Mail enabled\configured
  6. SQL Error Log file count and last cycled
  7. TempDB file count and sizes
  8. DB file locations (eg not with system dbs)
  9. Some key ‘best practice’ settings from sys.configurations
    • max server memory (MB) =
    • min server memory (MB) =
    • affinity I/O mask = 0
    • affinity mask = 0
    • affinity64 I/O mask = 0
    • affinity64 mask = 0
    • Agent XPs = 1
    • backup compression default = 1
    • cost threshold for parallelism = 25
    • Database Mail XPs = 1
    • default trace enabled = 1
    • fill factor (%) = 0
    • lightweight pooling = 0
    • max degree of parallelism = 0
    • optimize for ad hoc workloads = 1
    • priority boost = 0
    • recovery interval (min)= 0
    • remote admin connections = 1
    • scan for startup procs = 0
    • show advanced options = 1
    • xp_cmdshell = 1
  10. Database configurations
    • Status = ONLINE
    • Mirrored\AG member =
    • Published =
    • Subscriber =
    • RCSI =
    • Encrypted =
    • Read only =
    • Broker Enabled =
    • Compatibility Level = Server Compatibility Level
    • File growth in percent = 0
    • File growth > 10MB = 1
    • Page Verify = CHECKSUM
    • Recovery setting = (FULL|SIMPLE|BULK)
    • Forced Parameterization = 0
    • Auto Close = 0
    • Auto Shrink = 0
    • Auto Update Stats = 1
    • Auto Update Stats Asynch = 1
    • Orphaned Users Count  = 0
    • Suspect pages = 0
    • Separation of mdf and ldf


Health and Performance:

Server\OS:

  1. Monitoring – is it installed and running
  2. %Free Disk Space
  3. %Free Memory
  4. %CPU usage (snapshot or short history via ring buffer)

Instance:

  1. Waits (top 95th % percentile)
  2. Default trace
    • Count of key events (e.g. sorts, hash joins, file growth, etc.)
  3. Error Log
    • Scrape for Sev 16-25
  4. Count of suspect pages
  5. Jobs
    • Failed
    • Disabled
  6. Backup Jobs
    • Schedules and durations (overlaps?)
  7. Top 1-3 High Resource Use Queries (from system health extended event or plan cache)
  8. Recent Blocking & Deadlocking (system health extended event)
  9. Snapshot Batch\sec, Compilations and Recompilations
  10. Security
    • sysadmin
  11. Database
    • DB file sizes & space free
    • Database Backups
      • Date of most recent full and log
      • Destination
    • DB space allocation – data, index, allocated, unused
    • DB size trending (via backup size)
    • Tables\indexes
      • Heaps
      • Index Fragmentation
      • Index Use — unused, writes>reads, high-use\hot-spots
      • Missing Indexes (top 95th % percentile)
      • Duplicate Indexes
      • Overlapping Indexes
      • Stats last updated

… end of brain dump! Now, time to get to work and build some stuff!

I’m sure there could be more … whats on your SQL health check list?

TSQL Tuesday #67: Why extended? And why events?


tt150x150_thumb

Quiz

When I say Extended Events, what immediately comes to mind?

A) “Save save save at Hank Honda’s Happy Honda Days Sales Event! Now Extended through Monday!”

B) ”Although our cannoodler valves are of extremely high quality, with tight tolerances designed to last through several years of use, they may require maintenance in the event of a failure. For only 2 dollars, our one year extended warranty plan can potentially save you the cost of an expensive repair in the future.”

C) When I say Extended, you say Events.

Extended. Events! Extended. Events!

D) N.O.T.A.

If you are a SQL DBA like me, of course you know D) N.O.T.A is the correct answer. That’s because when I hear Extended Events I think of the MS SQL Server Extended Event (XE) feature. This is a TSQL Tuesday #67 post (thanks to Jes Borland (b|t) for hosting). Please bear with me as I shoe-horn my write-up, which I guess is kinda more theory than practice, into this month’s topic. I (arrg)… think it will (ggrgl)… fit …

So … why “extended”? And why “events”?

Events

Let’s start with this blurb from MSDN: “All applications have execution points that are useful both inside and outside an application. Inside the application, asynchronous processing may be enqueued using information that is collected during the initial execution of a task.” So while the SQL engine is humming along doing it’s stuff there are points within the executing code where stateful information can be branched off and made available to a monitoring application (in this case, XE).  When the executing thread hits those points… that is an event.

Just a quick review of the Extended Event feature will make it apparent that it shares many events with SQL Trace Events: SQL:Batch Completed = sql_batch_completed, Missing Join Predicate = missing_join_predicate, etc. In fact, since SQL2012 , Extended Events include ALL the events available in SQL Trace. And you might notice, as I did, that there is also a lot of overlap with the events available via DDL Triggers as well as in Event Notifications. AHA, I said to myself, and this was –for me -a big insight (YMMV), under the hood all these events are all the same thing! I was super lucky to get a chance to attend a SQL Skills class a few years back and they tell everyone in class this: If you have any SQL Server question you can email us and we will email you back. So I emailed a question to validate this idea and sure enough those guys got back to me within a day (so cool), saying – more or less – yep, under the hood XE events, SQL Trace events, DDL Trigger events, and Event Notification events … they are all pretty much the same thing.

Extended

But wait, there’s more. Much more. How about this ‘extended’ term? Well, along with the specific set information that comes along with each event, XE allows you to add on a number of ‘actions’. For example let’s take the wait_info event. The following info comprises this event: duration, opcode, signal duration, and wait type. We can build on this info by attaching ‘actions’; aka Global Fields, in general stateless in contrast to stateful, and roughly analogous to columns in SQL Trace. After the wait_info event has fired we can extend it by adding these actions to include more info like session_id, database_id, sql_text, etc.

You may have noticed the wait_info event info looks a lot like what you get back when you query sys.dm_os_wait_stats. And also, nothing at all like that is available in SQL Trace. Pick a DMV, any DMV, and there is a fair chance you’ll find that same info set (or part of it) is available in XE. So, here we have another way to think about the ‘extended’ in Extended Events – you get way more stuff than SQL Trace (I’m not sure this explanation of extended is technically correct according to MS, but it works for me). This brings us to part 2 where we will consider two more terms, but where I will not ask you to take a quiz.

Part II

Let’s talk about polling vs tracing (meaning tracing operations in general, not the specific tool\operation SQL Trace). To poll a metric on a SQL instance I might set up a job to regularly run a query and insert that data into a table. Later, I may grab that data and drop it in excel, perhaps to do some base-line analysis. So, here is a definition for polling – regularly collecting metric values for, typically, trend analysis. Tracing is different. Tracing exposes a single standout occurrence of interest or group of occurrences of interest (e.g. reads greater than 20K) for a range of time. When I collect a trace I usually identify the standouts and then I work to address the reason behind these standout occurrences. When I need to trace SQL Server, I set up a SQL Trace. Or, I should say, I used to…

Getting back to our wait stats example, before XE, to trace wait stats we are stuck with a polling methodology and that is not so simple to set up. Check out this script (the 1st one) from Glen Berry which accounts for the cumulative nature of sys.dm_os_wait_stats metrics.  Not that it’s too complex, but it’s not just select splat either. And you need a table to store the data. And you might want to purge that table regularly. And you need to schedule this query via SQL Agent. If you truly are trying to trace for interesting waits no schedule will be granular enough, there will always be a gap between snapshots. That’s where Extended Events comes in. Wait stats are a good example, but as mentioned above there are many more events available. XE opens up a lot of possibilities to trace for interesting events where we used to have to poll (or we had nothing at all). Add to that, setting up an XE session to do this tracing can be as easy as a few clicks in SSMS. So in this case the only question left to ask is…

How many waiting events do you want to collect?

A: ALL OF THEM because we can (umm, wait, no, not all of them… can we put some kind of filter on that?

Yes, yes we can. And we haven’t even mentioned all the options where we can write the results).

My Favorite Things

There you have it. A couple of my favorite things about XE – #1) aha moment regarding events and event consumers in SQL Server and #2) aspects of XE open up new troubleshooting and problem solving methods … Not too tech, hope y’all don’t mind. Just some ideas around how to think about this new tool. I imagine other TSQL-Tuesday posts will be more technical and I’m looking forward to reading those and learning. Thanks for reading!

VLFs: Very Large Flatabases (wait, what?)

Not everything is small in Flatland.

Remember that cool old book Flatland? Or maybe you saw the movie? Aside from the mashup title where I’m confounding VLFs and VLDBs this post has really not too much to do with Flatland (sorry). Except that, as you must know by now, I am a square.

I’m not the first square to post about virtual log files in the transaction log, but I’m guessing I won’t be the last either. So, with tons of credit to the SQL Skills crew (links below) where I picked up a good part of this, here’s my take on VLFs …

VLFs are logical management units within transaction log files – when a log file grows, it grows in VLF ‘blocks’, and when a log file truncates or shrinks, these operations also are applied to the file in blocks of VLFs. Additionally, during any database recovery operation (including cluster or mirror failovers, service restarts and database restores), each VLF within a t-log is examined to determine whether there are active transactions to roll forward. As you might imagine, an excessive number of VLFs can result in unnecessary overhead and delays in recovery time. Notice a DB that is taking an extra long time to come online after a service bounce? VLF count is the first things to check out.

Small values for a transaction log file auto-grow setting are the typical reason for too many VLFs. A good rule of thumb is that the auto-grow setting should be configured to generate VLFs of about 512 MB to 1 GB. Of course, the best solution is not to rely on auto-growth and manually size the transaction logs if and when you can. Either way, here is what you need to know to grow and\or set the auto-grow value.

SQL’s internal process to create VLFs follow these guidelines:

  • Growths of less than 64 MB and up to 64 MB generate 4 VLFs
  • Growths larger than 64 MB and up to 1 GB generate 8 VLFs
  • Growths larger than 1 GB generate 16 VLFs

Using these algorithms we can control a log file’s growth to achieve something close to the ideal 512 MB – 1 GB VLF size. In my experience the re-sizing process is usually part of a larger project to reduce VLF counts. The following steps outline the whole effort. This is a simple and effective way to get close to the file size and VLF count you want without getting lost in the minutia or splitting too many hairs.

This makes it easy:

  • Before you shrink the log file take note of the current size in MB, assuming this is the correct size, or make a note whatever the proposed new size should be.
  • Shrink, backup, repeat as necessary to minimize VLFs. This works best in a time of quiet so the log can clear easily. If there are many VLFs, quite a few transaction log backups may be required between each shrink since the shrink clears only the unused VLFs. Keep tabs on things as needed by noting the results of the DBCC Shinkfile.
  • Divide 8000 MB into the original size (or proposed new size), round up, and grow the log back that many times in multiples of 8000 MB (use 8000 MB b\c there is a bug in 4000 MB growth increments ). To explain, since each log file grow over 1 GB creates 16 VLFs, the 8000 MB grow results in approximate ideal VLF size of 512 MB.
  • For very large transaction log files – say over 240 GB – the growth statements can be issued in multiples of 16000 MB to create approximately 1 GB VLFs.
  • For smaller size logs –say less than 4 GB – a single growth statement is usually fine. Don’t pet the sweaty stuff.

Note, SQL 2014 has new rules around VLFs and file growths. The steps listed above still apply. It is a cool improvement. Check it out here:

Want to dig in? More VLF SQL Skills here :

Thank you for reading and happy shrinking\growing!

Right-sizing Multiple tempdb Files (or how I lost 30GB off my tempdev by following this one weird trick)

To follow up on my last post, here is a look at how to get the file sizing correct if\when it is determined that multiple tempdb files are a necessity. See that post for a discussion as to why multiple tempdb file might be needed. This post just concerns methods to get there… in this scenario we have a single tempdb data file and the challenge is to split it evenly into a number of same-sized files.  The post is in a Q&A format, so here we go…

Why would we need the same size tempdb data files?

Because of the way SQL decides which file to use for any given write. SQL uses a proportional fill method to evenly distribute writes across a set of data files within a filegroup. The files with the greater percent of free space get chosen for writes. Ideally this helps keeps a set of –let’s say- four files evenly filing up the file free space as SQL ‘round-robins’ it’s way through the files, selecting each as a write target in turn. It also ensure writes are distributed among the files and that no single file becomes a hot spot for writes.

SONY DSC

Not the Round Robin I meant.

However, this write-by-percent-free scenario can backfire. If one of the four files is mis-configured as significantly larger and has a larger percent for free space, that file gets the write every time (at least until the file free space percentages more or less match up, then it’s back to round-robin). In that case we may as well be back to only having a single data file since only one out of the four is getting writes. In fact, any file size or free space lop-sided-ness may inhibit the ideal round-robin write distributions. In the end, we really want evenly sized files (and, by the way, the same growth settings for each).

So, if you have one file and you need three more, just add three more files of the same size and let the proportional fill thing do its work, right?

Sure, that could work, but there is more to it…. let’s say our original tempdb data file (the mdf) is 40GB –  if we add 3 more evenly-sized files (the ndfs) – now we immediately have a 160GB tempdb! If we needed a larger tempdb anyway then that works out great, but it is not so great if tempdb is already appropriately sized.

It would be much easier if we could count on shrinking tempdb. Sticking to our example we might first shrink the tempdb data file to 10GB, then add three more ndf files at 10GB each. But it is not always so easy to shrink tempdb – especially if we have a very specific size in mind (10GB), and especially for a system with lots of tempdb use where the benefits of multiple tempdb files might be realized. In short, we do not want to just shrink the file to whatever, we want to re-size the file to particular size.

Let’s pause here and take a quick look at the toolset available to re-size SQL Server DB files.

  • DBCC SHIRINKFILE (<filename>,<filesize>) – the shrink file operation not only shrinks the file as much as possible, it also resets the data file size as you can see in the ‘size’ column if you query sys.database_files and\or sys.master_files like this:
select name, size/128 SizeMB  from <dbname>.sys.database_files where type_desc ='ROWS';
select name, size/128 SizeMB from sys.master_files where type_desc ='ROWS' ;
  • ALTER DATABASE <dbname> MODIFY FILE (NAME = <filename>, SIZE = <filesize>MB) –In contrast to DBCC SHRINKFILE, this option allows you to grow a file by resizing it. When you grow a file by this method, it behaves just like the DBCC SHRINKFILE command – the file size is reset to match the resize command. However, if you try to resize the file to a smaller size, you get an error:

MODIFY FILE failed. Specified size is less than or equal to current size.

And that’s the way it is for user files… but not for tempdb….

You mean to say that tempdb allows a DBA to alter a data file and re-size it smaller than the current size?

Yes. But not just that, we don’t have to apply the shrink immediately, we can defer the tempdb data file downsizing until the next sql service startup when the tempdb database file will be created new and at exactly the size we want.  This is actually explained in a KB here, but it is not very obvious.

Let’s try it:

Find the current size of tempdb mdf. For our running example this shows 40000MB (40GB)

select name, type_desc,size/128 SizeMB from tempdb.sys.database_files

Re-size to increase the file by 10GB

USE [master]

GO

ALTER DATABASE [tempdb] MODIFY FILE (NAME = N'tempdev', SIZE = 50000MB)

GO

Check the file size again – we should see 50000MB

select name, type_desc,size/128 SizeMB from tempdb.sys.database_files

Re-size to “shink” the file to 10GB

ALTER DATABASE [tempdb] MODIFY FILE (NAME = N'tempdev', SIZE = 10000MB)

Check the file size again. We should see 50000MB as if the alter statement failed…

select name, type_desc,size/128 SizeMB from tempdb.sys.database_files

…but if we look to sys.master_files to see our most recent modification we find the size is just what we asked for, 10000MB

select name, size/128 SizeMB from sys.master_files where type_desc ='ROWS' and database_id = 2

You will not see this same discrepancy if you use SSMS to size the files, its TSQL only. (Why? Because the TSQL modifies the tempdb ‘template’ in master, whereas the SSMS change attempts a DBCC ShrinkFile)

Interesting… So, how can we leverage this quirk of tempdb to solve the current issue – namely that we need to divide a single tempdb file evenly among several new tempdb files?

I’m glad you asked. There are two ways to go here; one is very hands-off but requires a bit of extra disk space on the tempdb drive, the other requires almost no additional space on the drive hosting tempdb beyond what tempdb is already taking, but will need to do some hands-on management after the sql service restart. Yep, sorry; to shrink and divvy up an existing single tempdb data file in to multiple evenly-sized files is going to require a restart. But wait, it might not be as bad as you think, read on….

Option 1: figure the current tempdb data file size and divide by the number of files which will ultimately be needed. This will be the files size of the new files. In our running example, we have a 40GB tempdb and we want 4 files. So we’ll add three 10GB files. This is where that extra disk space comes in – we need 30 free GB to create these files.

Then use the ALTER DATABASE command as described above to downsize the original mdf file to match the others. For our example we’ll re-size the file down from 40GB to 10GB. According to sys.database_files the mdf size is still 40GB, but the size in sys.master_files will be 10GB and that is the size the file will be created as when tempdb is created at start-up.

So now for the hands-off part; once this is set up (as long as no one tinkers with our size settings) we can walk away. The next service restart will re-create the mdf at 10GB and the 3 new ndfs at 10GB each for a total tempdb size of 40GB. Until then, writes will be distributed around the files, probably somewhat unevenly, but that should not do any harm and it is temporary. And once the sql service bounces per a planned maintenance, cluster failover, or whatever other reason, our multi-file tempdb will be in good shape.

Option 2: follow the same steps as option one here right up to sizing the 3 new files. In this case we just set all new ndf files to 1MB. Then “shrink” (re-size) the mdf as described.  Now we have three 1MB ndfs and one mdf of 40GB (but remember it is only 10GB according to sys.master_files). While we wait for the next service restart, writes will still mostly go to the mdf according to the proportional fill rules, so we haven’t really changed much of anything. After the reboot, we end up with a 10GB mdf file and 3 small 1MB ndf files which we can easily and quickly grow to match the mdf. Although arguably, it might be just as well to add and size the files after the service restart.

And finally, can you please tl;dr summarize?

To wrap it up: The tempdb database is a bit different when it comes to file sizing. In short this is because it is recreated on every start up and must look to the master database for its start-up configuration. Any tempdb file growth via ALTER DATABASE works like a user DB, i.e. the data file grows and new size becomes the initial start-up size. It’s the same for shrinks via DBCC SHRINKFILE – the shrink operation reduces the file size and the new size becomes the initial start-up size. Where tempdb differs is that it allows ALTER DATABASE command to re-size a data file to a smaller value, without actually changing the current file size. Instead, that new smaller value is held in master as the initial start-up size and leveraging this detail makes adding files to tempdb more precise and perhaps eases some of the hassles.
TempDB and Instance Standards

One of the ‘best practice’ practices I like to consider putting in place on a SQL instance is multiple tempdb files to eliminate any chance of tempdb allocation contention. Not that I’ve seen this allocation issue in the wild so much (although Paul Randal mentions it is pretty common in his experience), but having a couple-few, right-sized tempdb files a. doesn’t hurt, b. surely does help if there is a allocation issue, and 3. brings an instance into what I consider (for what its worth) a standard configuration. Like other what I’d call take-it-or-leave it configuration options (e.g. optimize for ad hoc workloads)*  sometimes its just as well to take-it since it at least indicates someone considered the whole picture of the server\instance and applied best practices.

Here is my version of a quick rundown to summarize the tempdb allocation issue: Every time that tempdb is used, the thread accessing tempdb must first find enough free space to build the temp object. It determines where it can locate this space by reading special pages – GAM, SGAM and PFS – which are evenly spaced throughout a database file. These pages serve as a kind of index to unused and available disk space. Every database has these pages, but tempdb is a special case since it is a shared resource which potentially any and every user may utilize. Herein lies the trouble; a bottleneck can develop when many threads need tempdb space and so require latches on these special pages.

The resolution is simply to distribute the load by adding more tempdb files. If the need for multiple tempdb files is evident, the current suggestion is 1 file per 1 logical CPU up to 8 logical CPUs, then, if contentions still exists, add 4 files at a time (up to the count of logical CPUs). All files should be the same size because this will allow SQL’s proportional fill algorithm to evenly allocate space in the files. Careful now –  if there are too many files this can be a performance problem as well since sort memory spills may spend extra time doing round robin allocations among many tempdb file. Note: trace flag 1118 forces all db allocations, system wide, to be in extents (not pages) and so is an option to specifically reduce contention on SGAM pages, including (but not limited to) tempdb SGAM pages.

So, how do you know if an instance has this kinda thing going on? Check out the query in this blog post Robert L Davis aka SQL Soldier or look back on the query in the SQL Skills post mentioned above. Both use sys.dm_os_waiting_tasks to ‘catch’  tempdb PAGEIOLATCH_ % waits red-handed. Pretty cool, but one draw back is that you have to go looking for these waits – polling the waiting tasks every-so-often. If you’d rather just sit back and let those waits come to you – so to speak – check out Kehayias’ SimpleTalk article ‘Optimizing tempdb configuration with SQL Server 2012 Extended Events’. Yeah, I know, SFA, next level cool.

Well, this post sort of turned into a reference of links on the tempdb allocation contention issue. Lets throw in one more for good measure. This is Adam Mechanics explanation in the context of his sp_whoisactive tool.

But anyway, getting back to the original point – what do you think friendly blog reader? (hi mom). Is there a set of ‘standard’ configurations you like to put in place on an instance? Perhaps regardless of whether or not their implementation is ‘proven’ as necessary?  Or is it just as well to manage a distinct set of configuration options for each instance? If you have instances that are less used or non-production is it worth the effort to standardize them? Or is it better to stamp every instance out of the same template regardless of use? If not, where\how do you draw the line between ‘must adhere to standards’ instances and ‘no big deal’ instances?

*take-it-or-leave-it configuration – some instance \ database configuration that wont hurt and may or may not help.

Fear, getting worked, and Eskimo rolls

About this time last year I was on a river trip. Some friends had lucked into a permit for the Main Fork of the Salmon in Idaho. The Main Fork of the Salmon is a designated Wild and Scenic River and, for anybody who loves wilderness, rivers and white water, the Salmon is surely on their bucket-list. I got clearance from the home-front for the 9 day trip – a couple days of travel and 7 days\6 nights floating the 80 miles of river and camping on the beaches –  and jumped at the opportunity.  Most in the group of my friends planned on oaring their rafts. I had an old whitewater kayak collecting dust in the garage, so rather than riding shotgun in someone else’s rig, I planned to dust off my Eskimo roll and paddle the class 3 rapids.

salmon

Main Salmon River

About this time last month, I presented ‘Top 10 Issues Identified by SQL Health Checks’ on back-to-back nights for SQL Server User Groups in Toledo and Detroit.

How are these apparently disparate events related?

After pushing off the beach in the Salmon we ran a few easy rapids, but then the water slowed and pooled up as the river got ready to drop through the first section of class 3 water. As I approached the tongue of the rapid I could see bright white splashes of white water jumping above the river’s horizon-line – I began to have some serious doubts about what I was getting into… In case I gave you the wrong impression about my kayak skills, let me explain that – aside from one day of practice on the Colorado River – the last time I paddled was about 10 years ago, and I was no too good at it back then. Like riding a bike, you never really completely loose paddling skills you do have, but they sure do atrophy!

The last time I spoke publicly was also about 10 years ago – but that was on the topic of deep ecology for my environmental science classmates as part of a senior assignment – an easy crowd.

On the river – approaching what basically looked like a small waterfall – I had these feelings of fear. I even turned around and began paddling back up river with the hope of catching a ride on one of the rafts. But it was way too late for that (the Salmon is known as The River of No Return), I was already committed. I had to face it. Deep breath. Lean forward. Get lined up … and ….Paddle!

It went great for the first couple moves. And then I missed a brace and I went over. And … I. Got. W.O.R.K.E.D! A trip to the laundry-mat.

I managed a roll and came upright – still mid-rapid – facing up river looking at the treed steep slopes of the canyon, the blue sky, and the mirror-still pool above the white-water cascade. And I.Was.Totally.Stoked! The mental snapshot of that time and place and feeling I will never forget.

Speaking at the Toledo and Detroit SQL Server User Groups was not quite the same caliber of drama and adventure surrounded by nature’s beauty. But I did have the same fear, the same no-going-back commitment, the same deep breath….

IMG_6234

And… well… heh heh…  I.Got.WORKED – at some points it sure felt like that.

In fact both presentations went fairly well. I got some ‘goods’ and a few ‘excellents’, but there is also a good sampling of ‘fair’ and ‘poor’ boxes checked in the evaluation forms from the events. The standards are high. These are Professional Association of SQL Server (PASS) User Groups so this is Class 3 speaking after all. A little more prep time, a little more speaking experience — I think I know I could do better. To cut myself a little slack though, I did get through the irrational fear of it all and broke the seal, My next time presenting won’t be my first time presenting (and next time is coming up pretty quickly)

And now I’m stoked! I had a chance to meet some very nice people in both cities. Much thanks to the organizers and attendees. (I even had a beer with MVP Jeff – RBAR – Moden). I’m attending my local PASS meetings (after too long away) and I hope to present there soon. I’ll be at the local toast masters meetup next month to work on this speaking skill. I’m signed up for some multi-day SQL training early next year to keep improving those skills. And, as part of a new job role, I’ll be presenting at IT Dev Connections in Las Vegas in September.

As for kayaking, there is an upcoming weekend class I hope to attend.

So, cheers! Keep the fun side up, and here is to facing your fears – even when you get worked!

P.S. I haven’t written here in a while, but I have been posting over at my company’s blog   on The Data Collector, Hekaton, and other topics.