Author Archives: admin

Change Tracking – what is really going on during change tracking cleanup operations?


In  my environment we see an occasional situation where a system process blocks user process.  To find what the system process was doing we looked to the wait_resource column in sys.dm_exec_requests to see what pages the user session was waiting  on. We then took the pages numbers and looked to DBCC PAGE  to determine the object. This led us to the syscommittab table – the global ‘log’ table for the change tracking feature. Of course we noticed all the blocked user process use change tracking functions so that was a clue as well…

I set out to find out what I could about the cleanup process. I’m not the first one to have problems with change tracking. Here are a couple links where others are trying to get a handle on this –  mostly – black box:

https://blogs.msdn.microsoft.com/sql_server_team/tag/change-tracking-cleanup/

These posts gave me a better understanding –  especially with regards to how the side tables and the syscommittab log table hand off “delete-watermark” values to each other (i.e. versions less than a “delete-watermark” will be deleted):

Using a test database with an approx 20 million row syscommittab I was able to watch the process via extended events and came up with these observations.

  • Auto-cleanup runs every 30 minutes. The initial cleanup seems to be run is 30 minutes after auto-cleanup is first turned on. Successive runs are every 30 min after the end of the previous cleanup. This means long running cleanup operations will postpone any further cleanup.
  • Auto-cleanup process side tables (in descending order by side-table object id) serially. Side table rows are deleted in batches of 5000. Some cleanup process – especially for large tables – do not complete and that failure is logged in SQL Error Log as ‘ <side table blocked> ’ type messages.
  • Only after all side tables have been processed (with or without the ‘side table blocked’ error) does the auto-cleanup go to work on purging syscommittab. The syscommittab cleanup works in batches of (default) 10000. The syscommittab cleanup process takes the minimum cleanup version from all the recent side-table cleanups and deletes rows from syscommittab with versions older than that minimum cleanup version. If the minimum cleanup version returned by the side table cleanup is less than the retention version (per change traking configuration retention setting) no syscommittab rows can be cleaned up. It can be a long time between syscommittab cleanups due to ‘every 30 min’ (bullet 1 above) and ‘side table blocked’ error (bullet 3 above) which inhibits the advancement of the minimum cleanup version.
  • Manual side table cleanup follows the same rules as auto-cleanup – namely it will not clean any rows unless auto-cleanup is turned on and then the first cleanup cycle starts after auto-cleanup has been tuned on for 30 minutes.
  • Manual syscommittab cleanup also requires auto-cleanup to be turned on. If the most recent minimum cleanup version returned by the tables is less than the retention version no syscommitab rows can safely be cleaned up and no rows will be deleted.

Due to all the points above you can see the cleanup process is less than ideal and syscommittab may not be cleaned often enough to keep up with growth. And the larger it gets the longer between cleanup cycles which leads to further un-checked growth. When (if) the cleanup does finally kick in on syscommittab, the delete process can be long-running – up to 40 minutes in test cases. During this syscommittab delete process the locks against the syscommittab table block user session using change tracking functions.

Also of interest, once a ‘delayed’ delete process does complete on a large syscommittab table there is typically a long checkpoint (5 min in tests) which has production impacts of it’s own…


Stay tuned for more on change tracking


Distributed Availability Groups Illustrated

Remember Database Mirroring?

I do. Vaguely.

In particular, I remember working with Database Mirroring (DBM) as part of an interesting -and complex- HADR setup. Visualize a 4-node windows fail-over cluster in Data Center 1 with SQL Server installed on each node (lets call it a 4XActive). We have high-availability covered here via the clustered instance. Given an outage for any given node, the SQL instance will move (fail-over) to another node.

On the other side of town, in Data Center 2, is another 4XActive.

Now, here’s the DR part. Every database on each instance is replicated from Data Center 1 to Data Center 2 via DBM. To explain, here’s a ppt slide I’m borrowing from my recent presentation on this stuff:

This worked! Pretty well in fact. But of course, knowing what I know now, I clearly remember the limitations and paint points:

  • Single point of failure in the cluster’s shared disks hosting database files
  • No “readable” replica for scale-out reads (we use transnational replication to create a report instance)
  • No automatic fail-over – yeah DBM has auto-fail-over capability but I’m thinking more about application connections… it was not easy to quickly re-direct connections from DC1 to DC2.
  • No grouped database fail-over (in this case, up to 4 database were related (tenant architecture) and there was no easy method of failing them over a unit)

I bet you saw this coming, but the answer to these limitations -and others like them- came along when SQL introduced Availability Groups.

HADR and Availability Groups

A basic availability group will solve for HA via a synchronous fail-over replica partner, and scale-out reads via a readable replica. But it gets a bit more complicated if you need to build-in DR as well. Here’s another slide to illustrate one option to add DR to your HA using Availability Groups:

In this case we add a cluster node in a remote data center to a standard AG configuration. This is the DR node (and it might also serve dual duty as the read-replica). Seems legit, right? But what are the drawbacks? To my thinking, there is a lot of management complexity. Consider the configuration and administration of a cluster over WAN and multi-domain and\or multi-subnet clusters.

Which bring us to …. Distributed Availability Groups

What if you could have the best of both worlds? Local availability groups in both the production and DR data centers, optional scale-out reads on the DR side, and replication between the two?

Tada!

Check it out, that is just what we get with Distributed Availability Groups.

Thanks for reading, please stay tuned for more on this topic…


Au Revoir 2016, Bienvenue 2017!

Au Revoir 2016, Bienvenue 2017!

Ca Va! No, I don’t speak French but that never stopped these guys: Foux Da Fa Fa. And this title, as they say in France, has a certain “oh I don’t know what” ring to it.

Sacrebleu I was a busy throughout 2016. Mostly working on… well… mostly the work this blog documents, but also unclogging garbage disposals, driving kids to bus stops, fixing broken things, and filling\emptying wheelbarrows. It seems I barley took the time to look up and look around. Looking back on it now with a bit of the ol’  l’esprit d’escalier, I can see it was clearly an amazing year for me! Here are a few highlights in photos:

Le Grand Teton

In June my friend Dan and I climbed to the summit of the Grand Teton. We had tried this climb quiet a few times in past years, so it was excellent to finally achieve it. I love it there and I want to go back.

tetonsfromgate gtsummitme

Le Labyrinthe

The Maze is one of three districts in Canyon Lands National Park. It has so much great stuff: natural and cultural history, rivers, rocks, and sky. My friend Greg and I loaded up our bikes rode in the 20-or-so miles to set up a base camp for a few days of exploring. I love it there and I want to go back.

memazebygreg gregandpackedbikes

SQL PASS 2016

Back to the professional side of things, I had the chance this year to present at the Professional Association of SQL Server. I partnered up with Pinal Dave to deliver a talk on Database Backups in SQL Azure VMs. Pinal is a great guy and I really had fun hanging out with him while we prepped. (Our topic and presentation slowly gelled as we took every opportunity to meet, both in Bangalore IND as well as Seattle USA). The 10am presentation itself went well with Pinal’s exuberance and humor saving us all from falling back to sleep. We ended up with a deadpan\comic dynamic as you might be able to see in the photo. Not sure I’ll ever get the chance to do that again, but if I do I’ll take it.

2016-10-27-10-43-26

India 2016

I visited Mumbai and Bangalore India for my second time (last time was 2014). This trip I gave a few classes on Azure to DBA colleagues but just as importantly I had the chance to hang out with awesome people in a really cool country. I love it there and I want to go back.

meandteam

So, to summarize…

1. GRATITUDE!

2. OK 2017, LETS GO!

‘Till next time, enjoy every baguette

Reducing SQL2000 to SQL2014 DB Migration Outages

Say you’re making a big jump and upgrading a database from SQL 2000 to SQL 2014. Of course it only makes sense that this will be a side-by-side upgrade and therefore you’ll need a plan to migrate your DB from the SQL2000 box to the SQL2014 box. SQL2014 won’t allow a restore or attach of a SQL2000 DB. SQL2014 only allows restore or attach of SQL2008 DBs and later. So we need a 2-hop migration plan – here’s a “you get the general idea” sketch of the plan:

  1. disconnect DB connections – outage begins
  2. backup the SQL 2000 DB
  3. copy the backup to the SQL2008 server
  4. hop 1- restore the DB to the SQL2008 instance
  5. backup the SQL 2008 DB
  6. copy the backup to the SQL2014 server
  7. hop 2 – restore the DB to the SQL2014 instance
  8. redirect DB connections & etc. – outage ends

The good news for our 2-hop plan is the intermediate SQL2008 instance need not be production caliber any way – it’s a just a  temporary stop-over on the way to update the DB so we can restore it to SQL2014. The bad news is, this 2-hop plan complicates the migration plan and extends the potential outage as we copy\paste database backups or data files over the network between the three servers.

But there is a way to simplify the plan and minimize the outage. Let’s try this:

  1. disconnect DB connections – outage begins
  2. detach the SQL 2000 DB
  3. copy the database files to the SQL2014 server
  4. hop 1- attach the DB to the SQL2008 instance
  5. detach the SQL SQL2008 DB
  6. hop 2 – attach the DB to the SQL2014 instance
  7. redirect DB connections & etc. – outage ends

We’re using detach\attach here rather than backup\restore but that’s not too important – things would work out fine either way. The thing to notice is that we lost a step and – more importantly – gained back the time it takes to “6. copy the backup to the SQL2014 server”. We only need one copy operation – from the SQL2000 server direct to the target SQL2014 server. Depending on DB size, network speeds and copy methods, that might be a lot of time saved.

How can this work? Because SQL2008r2 (and SQL 2008 with -T1807) allows the database file path to be a UNC – i.e. in this case a file share to the DB files on the SQL2014 server.
So, the hop 1 (step 6 above) might look something like this:

USE master;

GO

CREATE DATABASE MyAdventureWorks

ON (FILENAME = '\\SQLServer2014\MySQLServer\AdventureWorks2012_Data.mdf'),

(FILENAME = '\\SQLServer2014\MySQLServer\AdventureWorks2012_Log.ldf')

FOR ATTACH;

GO

Read up on it here: Description of support for network database files in SQL Server.

This sketch is skimming over quite a few other considerations so be sure think through all the other migration do-s and don’t-s (some more ideas here if you like). And don’t forget to clean up that file share once the migration is complete. Happy (migration) trails to you! 😐

Balancing SQL Server Min and Max Memory on an Active\Active Cluster

Consider a 2-node cluster with 7 instances. Each node has 8CPU (logical) and 64GB of RAM. It’s a (so-called) active\active configuration.  Two of the instances are especially high-resource-use and are segregated to their preferred node. The other instances are relatively quiet, using minimal CPU and RAM, and are split-up 2 and 3 to their preferred nodes.

This is what I’m working with recently and I decided to write up a quick post on apportioning memory to these clustered instances.

To start, when I came on the scene, min and max memory for each instance was configured as if all the instances shared a single server (node).

Pref. Node Instance  Min Mem Max Mem
A SQL1  0 16384
B SQL2  0 12288
A SQL3  0 4096
A SQL4  0 4096
B SQL5  0 4096
B SQL6  0 2048
B SQL7  0 2048

Total RAM dedicated to SQL instances cluster-wide here is 45GB leaving plenty of head-room even when all instances are running on one node.

That is ok and it certainly ensures if (in the case of an unplanned outage) or when (in the case of a planned outage) all instances fail over to a single node, there will be enough RAM to go around for each instance. But, in the day-to-day preferred configuration, with one high-use instance on each node, that leaves many GB of RAM unused (and un-usable per the max memory setting).

So I want to re-apportion memory among the instances for the typical, day-to-day operating configuration and give more of that unused RAM to our two high-use instances.

I start by understanding there will be times when all instances will run on a single node. When that occurs, how much of the total RAM should SQL use? In this case I’d like to leave ~14 GB to the OS and other, non-sql engine processes. So that leaves me with 50GB for the SQL servers and a question of how to split it up among the instances.

This is where a multi-server query comes in handy. If you create a local server group in SSMS (or use a central server) to include all the clustered instances and run a query against them, you can begin to get a sense of which instances will need more memory and which will need less. Here is a query I use as a mulit-server query to capture a snapshot of each instance’s minimum and maximum memory configuration, total and target memory usage, and PLE.

;with cte as (
select @@SERVERNAME as 'Instancename',
max(case when name = 'min server memory (MB)' then value_in_use end) as 'MinServerMemoryMB',
max(case when name = 'max server memory (MB)' then value_in_use end) as 'MaxServerMemoryMB'
from sys.configurations)
select p.Instancename,
os.PhysicalCPUCount,
os.PhysicalMemoryMB,
c.MinServerMemoryMB,
c.MaxServerMemoryMB,
p.TargetServerMemoryKB/1024 as 'TargetServerMemoryMB',
p.TotalServerMemoryKB/1024 as 'TotalServerMemoryMB',
p.PLE ,
(p.TotalServerMemoryKB)/p.PLE as 'ChurnKB/sec'
from(
select @@SERVERNAME as 'Instancename',
max(case when counter_name = 'Target Server Memory (KB)' then cntr_value end) as 'TargetServerMemoryKB',
max(case when counter_name = 'Total Server Memory (KB)' then cntr_value end) as 'TotalServerMemoryKB',
max(case when counter_name = 'Page life expectancy' then cntr_value end) as 'PLE'
from sys.dm_os_performance_counters)
as p
join cte c on p.instancename = c.instancename
join
(SELECT @@SERVERNAME as 'Instancename',
cpu_count AS 'LogicalCPUCount',
hyperthread_ratio AS 'HyperthreadRatio',
cpu_count/hyperthread_ratio AS 'PhysicalCPUCount',
physical_memory_in_bytes/1048576 AS 'PhysicalMemoryMB'
FROM sys.dm_os_sys_info ) as os
on c.instancename=os.instancename

By analyzing total vs target and PLE counters I can start to generalize where the majority of the RAM should go and how to divvy it up. Once I get that figured out I can make the changes to the minimum memory configuration. Minimum because, remember, this is solving for the situation where all instances have failed over to one node. If we set minimum for each instance that leaves some RAM for the OS and etc. but also enforces the instances share the 50GB,

Turning now to the maximum memory configuration and considering day-to-day active\active usage, I can now give my high-use instances a big chunk of RAM since, once they are on their preferred node, they don’t have to share memory. Here is how it looks:

Pref. Node Instance  Min Mem Max Mem
A SQL1 20480 41984
B SQL2 22528 44032
A SQL3 2048 4096
A SQL4 2048 4096
B SQL5 1024 2048
B SQL6 1024 2048
B SQL7 1024 2048

if you add it up, total minimum memory is 50GB (50176MB). This is what each instance gets – guaranteed (some exceptions apply 😉 ) – when everything is running on one node. As for max memory, note that memory total for each node adds up to 50GB. So, in active\active mode the SQL servers are able to utilize close to the available RAM (50 of the 64GB) and thereby improve performance.

This all works out fine for any variation of a fail-over –  either the whole cluster, or just for specific sql services moving around. Of course, the only ideal situation is when each instance is on it’s preferred node since that is what we just configured for… Any other arrangement should be considered temporary.

If you have more than one NUMA node you may need to tweak the query above. Read-up on SQL Skills take on PLE per NUMA nodes here  (which also links to the source of the idea behind the ‘churn’ metric in the query). One last thing, changing max and min memory settings clears the procedure cache. Be careful out there.

I’ve got a blank space baby… and it is filled in by my ConfigurationFile.ini

Check this out – the almost last page of a SQL install, Ready to Install. See the configuration file path at the bottom?

config-file-path

Recently I have been doing many SQL installs on Azure VMs. As AOAG ‘nodes’, each install needs to be, basically, the same. There are options for imaging Azure VMs but in this case I don’t have access to the portal. As a time saver I have been using these configuration files.

As I complete the first install with everything set up as required, I copy the configuration file path and then kick off the install. I paste that path into Windows Explorer which opens the .ini file — select all and copy. Next I move to my secondary, or secondaries, and quickly create a new text file on the desktop, paste, and save.

When I fire up the install-able on the secondary, I don’t go to ‘Installation’ as usual, instead I go to ‘Advanced’ and choose ‘Install based on a configuration file’.

capture

Now I have the chance to browse to the .ini config file on the desktop (kinda PITA that it has to be an .ini).

browse-to-template-file

Once that loads I’m off and clicking! Next, next, next, next, next, next, next with Taylor Swift tunes  echoing through the catacombs of my mind. Where necessary, I still need to input passwords, but otherwise all the “blank spaces” are filled in;  feature selections, root directory, shared feature directory, server and engine configuration (e.g. data directories), and so on.

No big deal, but a bit of a time saver when I want a set of SQL Servers to ‘match’ and it helps me to avoid one-off mis-configurations.


Proto-DBAs – Our Proud Heritage

Take a second to consider this amazing time we live and work in. We are tech pros and we are riding this huge historical wave of the information revolution. This revolution is not even close to over, we are somewhere in the middle of it all and who knows how far it will take us. But one could say it all started somewhere around the invention of the telegraph. As DBAs, perhaps we can point to our own little stripe of the revolution beginning with Dr. Cobb’s renown RDBMS paper. Somewhere there along the line after that, and after data became a ‘thing’, the DBA profession grew from necessity and progressed into what we do today.

But I’m here to say the DBA type has been around long before IT and data and the need to manage and secure data. Somebody has always been there, working diligently, keeping things running smoothly; sometimes completely behind the scenes but also sometimes as supporting actors in classic situation comedies.

Folks, these are the for-bearers of our esteemed profession. These are the proto-DBAs we have evolved from. Let’s take a look at a few prime examples of our proud legacy.

Goober

gooberThat beanie, that smile, the pocket full of pens and gauges … this guy is capital D.B.A. personified. Way before anyone was tuning stored procedures, Goober was keeping the squad cars running like a scalded dog and making sure Aunt Bee’s Hudson made it to the market and back. Once, he disassembled Gilly Walker’s car and rebuilt it —from the ground up — in the court house! Talk about skillz!  Reminds me of that one time I did that thing with transactional replication… Goober and his fellow proto-DBA cousin Gomer kept the gasoline and commerce flowing in Mayberry, NC. Bonus: he speaks truth to power!


Cooter

cooter

Another genius mechanic from the deep south, them Duke boys could always count on “Crazy Cooter”. Fast-forward 30 years, drop this guy in DT Hotlanta, and people would instinctively know – That guy is a DBA. General Lee draggin’ it’s tail? Cooter can fix it. Meanwhile y’all can borrow his super-charged El Camino. Now tha’s some high availability I tell you what. What’s that, chasing Boss Hog’s counterfeiting thugs and now the El Caminos crashed? Shooooot, proto-DBA Cooter’s got you bacccccccckeeeed-up. Use his super-charged 1971 Chevy pickup. It ain’t pretty, but you’ll still outrun Roscoe P. Coaltrain… queue-queue-queue.

Schneider

Never without his tool belt, Dwayne Schneider is there for you anytime day or schniedernight, all you have to do is call or page or email or text or skype or IM him. He’s not in his office – he’s waiting just outside your cube. He can fix anything, he can fix everything. One day at a time. And on that key chain there… he has the master key!


Ol’ Lonely

ollonley

Do you have your responsibilities at your shop just so totally dialed that you find yourself whiling away long afternoons staring into the screen like Ol’ Lonely here? Me either. But this proto-DBA and his super reliable Maytag washing machines is setting the example for all of us on how it’s done — I hope you are never lonely but let us all aspire to this level of greatness.


Maybe you are thinking – hey, you missed the professor from Gilligan’s Island, My Favorite Martian, and Wally Cleaver. No, those are examples of  proto-developers. I hope that clarifies things a little.


Who are your favorite proto-DBAs?


About the author: Drawn to database work since discovering the SQL language uses all caps, for related reasons, Andrew is now learning MongoDB administration.

What would a perfect SQL Server health check report look like?

Here’s a brain-storm wish list of my dream sql health check (Did I really just say that? Dream sql health check? I did, didn’t I. That’s it, I’m knocking off early for a pint).

—————————————————————–

Useful for a DBA – minimum of unnecessary information, focus on actionable items, pinpoints issues to improve health

Deliverable to other DBA or interested party – focus on showing steady improvement or consistently high overall health. Should be explainable, organized, professional, comprehensive, readable and understandable. Should satisfy – to some degree – typical audit requirements.

Quantifies health (e.g. 60%, B-, 5/10). The health quantification should be meaningful and easily explainable.

Illustrates trends in overall health over time

Leverages post SQL2008 out-of-box ‘health’ features – system health extended events and ring buffers, policy based management.

Centralized collection (w\option for single instance runs)

Customizable:

  • Include some functionality that examines policies in the Policy Based Management for specific categories of policies and reports on them.
  • Include some functionality that examines jobs for a specific category that would indicate a custom maintenance job and possibly prioritize them in the report.

Configurable:

  • Allows exclusion of some checks, but this idea can be expanded on so that – for instance – a daily health check is executed for just the backup section of the report. Via a SSRS subscription or db_mail this backup report would be emailed to the DBA team and\or the DB owner for morning review. This could be helpful solution for a number of different frequently requested reports – index frag, disk space, ect.
  • Incorporate an ‘.ini’ configuration file for each instance (could be txt or xml) to keep ideal configurations. Initially the ini file contains best-practice\default values, but the DBA either brings the instance in line with the best-practice\default values or – in case of exceptions – edits the ini file to match the instance settings. In this way the overall health visibly improves.

There are three categories health check info falls into. A report could be organized according to these categories and with sub heading for server, instance, database, table levels ….

  1. Informational
  2. Configurations
  3. Health

And here’s a list of what could be included in each category.

Informational:

  1. Overall Heath Rating\Grade
  2. OS Version and Service Pack
  3. Is Physical \ Virtual
  4. Clustered
    • Nodes ect
  5. CPU (make\model, speed, platform (32\64bit)
  6. RAM
  7. Disk
  8. Uptime
  9. Description of use e.g. “sharepoint server”, “backend of web, critical”
  10. ServerName\InstanceName
    • Version
    • Edition
    • SP
    • CUP
    • Global Trace Flags
  11. Logical CPUs
  12. Memory
    • Min \ Max
    • Total Server Memory \ Target Server Memory
    • PLE Snapshot
    • Is AWE?
  13. MDOP
  14. CTHFP

Configurations:

Server

  1. VAS =
  2. SQL Service has lock pages in memory?
  3. SQL Service account instance file initialization?

Instance

  1. SQL Service account
  2. PBM enabled\configured
  3. Data Collector enabled\configured
  4. Resoure Gov enabled\configured Login trigger?
  5. Database Mail enabled\configured
  6. SQL Error Log file count and last cycled
  7. TempDB file count and sizes
  8. DB file locations (eg not with system dbs)
  9. Some key ‘best practice’ settings from sys.configurations
    • max server memory (MB) =
    • min server memory (MB) =
    • affinity I/O mask = 0
    • affinity mask = 0
    • affinity64 I/O mask = 0
    • affinity64 mask = 0
    • Agent XPs = 1
    • backup compression default = 1
    • cost threshold for parallelism = 25
    • Database Mail XPs = 1
    • default trace enabled = 1
    • fill factor (%) = 0
    • lightweight pooling = 0
    • max degree of parallelism = 0
    • optimize for ad hoc workloads = 1
    • priority boost = 0
    • recovery interval (min)= 0
    • remote admin connections = 1
    • scan for startup procs = 0
    • show advanced options = 1
    • xp_cmdshell = 1
  10. Database configurations
    • Status = ONLINE
    • Mirrored\AG member =
    • Published =
    • Subscriber =
    • RCSI =
    • Encrypted =
    • Read only =
    • Broker Enabled =
    • Compatibility Level = Server Compatibility Level
    • File growth in percent = 0
    • File growth > 10MB = 1
    • Page Verify = CHECKSUM
    • Recovery setting = (FULL|SIMPLE|BULK)
    • Forced Parameterization = 0
    • Auto Close = 0
    • Auto Shrink = 0
    • Auto Update Stats = 1
    • Auto Update Stats Asynch = 1
    • Orphaned Users Count  = 0
    • Suspect pages = 0
    • Separation of mdf and ldf


Health and Performance:

Server\OS:

  1. Monitoring – is it installed and running
  2. %Free Disk Space
  3. %Free Memory
  4. %CPU usage (snapshot or short history via ring buffer)

Instance:

  1. Waits (top 95th % percentile)
  2. Default trace
    • Count of key events (e.g. sorts, hash joins, file growth, etc.)
  3. Error Log
    • Scrape for Sev 16-25
  4. Count of suspect pages
  5. Jobs
    • Failed
    • Disabled
  6. Backup Jobs
    • Schedules and durations (overlaps?)
  7. Top 1-3 High Resource Use Queries (from system health extended event or plan cache)
  8. Recent Blocking & Deadlocking (system health extended event)
  9. Snapshot Batch\sec, Compilations and Recompilations
  10. Security
    • sysadmin
  11. Database
    • DB file sizes & space free
    • Database Backups
      • Date of most recent full and log
      • Destination
    • DB space allocation – data, index, allocated, unused
    • DB size trending (via backup size)
    • Tables\indexes
      • Heaps
      • Index Fragmentation
      • Index Use — unused, writes>reads, high-use\hot-spots
      • Missing Indexes (top 95th % percentile)
      • Duplicate Indexes
      • Overlapping Indexes
      • Stats last updated

… end of brain dump! Now, time to get to work and build some stuff!

I’m sure there could be more … whats on your SQL health check list?

TSQL Tuesday #67: Why extended? And why events?


tt150x150_thumb

Quiz

When I say Extended Events, what immediately comes to mind?

A) “Save save save at Hank Honda’s Happy Honda Days Sales Event! Now Extended through Monday!”

B) ”Although our cannoodler valves are of extremely high quality, with tight tolerances designed to last through several years of use, they may require maintenance in the event of a failure. For only 2 dollars, our one year extended warranty plan can potentially save you the cost of an expensive repair in the future.”

C) When I say Extended, you say Events.

Extended. Events! Extended. Events!

D) N.O.T.A.

If you are a SQL DBA like me, of course you know D) N.O.T.A is the correct answer. That’s because when I hear Extended Events I think of the MS SQL Server Extended Event (XE) feature. This is a TSQL Tuesday #67 post (thanks to Jes Borland (b|t) for hosting). Please bear with me as I shoe-horn my write-up, which I guess is kinda more theory than practice, into this month’s topic. I (arrg)… think it will (ggrgl)… fit …

So … why “extended”? And why “events”?

Events

Let’s start with this blurb from MSDN: “All applications have execution points that are useful both inside and outside an application. Inside the application, asynchronous processing may be enqueued using information that is collected during the initial execution of a task.” So while the SQL engine is humming along doing it’s stuff there are points within the executing code where stateful information can be branched off and made available to a monitoring application (in this case, XE).  When the executing thread hits those points… that is an event.

Just a quick review of the Extended Event feature will make it apparent that it shares many events with SQL Trace Events: SQL:Batch Completed = sql_batch_completed, Missing Join Predicate = missing_join_predicate, etc. In fact, since SQL2012 , Extended Events include ALL the events available in SQL Trace. And you might notice, as I did, that there is also a lot of overlap with the events available via DDL Triggers as well as in Event Notifications. AHA, I said to myself, and this was –for me -a big insight (YMMV), under the hood all these events are all the same thing! I was super lucky to get a chance to attend a SQL Skills class a few years back and they tell everyone in class this: If you have any SQL Server question you can email us and we will email you back. So I emailed a question to validate this idea and sure enough those guys got back to me within a day (so cool), saying – more or less – yep, under the hood XE events, SQL Trace events, DDL Trigger events, and Event Notification events … they are all pretty much the same thing.

Extended

But wait, there’s more. Much more. How about this ‘extended’ term? Well, along with the specific set information that comes along with each event, XE allows you to add on a number of ‘actions’. For example let’s take the wait_info event. The following info comprises this event: duration, opcode, signal duration, and wait type. We can build on this info by attaching ‘actions’; aka Global Fields, in general stateless in contrast to stateful, and roughly analogous to columns in SQL Trace. After the wait_info event has fired we can extend it by adding these actions to include more info like session_id, database_id, sql_text, etc.

You may have noticed the wait_info event info looks a lot like what you get back when you query sys.dm_os_wait_stats. And also, nothing at all like that is available in SQL Trace. Pick a DMV, any DMV, and there is a fair chance you’ll find that same info set (or part of it) is available in XE. So, here we have another way to think about the ‘extended’ in Extended Events – you get way more stuff than SQL Trace (I’m not sure this explanation of extended is technically correct according to MS, but it works for me). This brings us to part 2 where we will consider two more terms, but where I will not ask you to take a quiz.

Part II

Let’s talk about polling vs tracing (meaning tracing operations in general, not the specific tool\operation SQL Trace). To poll a metric on a SQL instance I might set up a job to regularly run a query and insert that data into a table. Later, I may grab that data and drop it in excel, perhaps to do some base-line analysis. So, here is a definition for polling – regularly collecting metric values for, typically, trend analysis. Tracing is different. Tracing exposes a single standout occurrence of interest or group of occurrences of interest (e.g. reads greater than 20K) for a range of time. When I collect a trace I usually identify the standouts and then I work to address the reason behind these standout occurrences. When I need to trace SQL Server, I set up a SQL Trace. Or, I should say, I used to…

Getting back to our wait stats example, before XE, to trace wait stats we are stuck with a polling methodology and that is not so simple to set up. Check out this script (the 1st one) from Glen Berry which accounts for the cumulative nature of sys.dm_os_wait_stats metrics.  Not that it’s too complex, but it’s not just select splat either. And you need a table to store the data. And you might want to purge that table regularly. And you need to schedule this query via SQL Agent. If you truly are trying to trace for interesting waits no schedule will be granular enough, there will always be a gap between snapshots. That’s where Extended Events comes in. Wait stats are a good example, but as mentioned above there are many more events available. XE opens up a lot of possibilities to trace for interesting events where we used to have to poll (or we had nothing at all). Add to that, setting up an XE session to do this tracing can be as easy as a few clicks in SSMS. So in this case the only question left to ask is…

How many waiting events do you want to collect?

A: ALL OF THEM because we can (umm, wait, no, not all of them… can we put some kind of filter on that?

Yes, yes we can. And we haven’t even mentioned all the options where we can write the results).

My Favorite Things

There you have it. A couple of my favorite things about XE – #1) aha moment regarding events and event consumers in SQL Server and #2) aspects of XE open up new troubleshooting and problem solving methods … Not too tech, hope y’all don’t mind. Just some ideas around how to think about this new tool. I imagine other TSQL-Tuesday posts will be more technical and I’m looking forward to reading those and learning. Thanks for reading!

SQL Server Database Mirroring: Not Dead Yet (tips, tricks and hacks)

Not dead yet

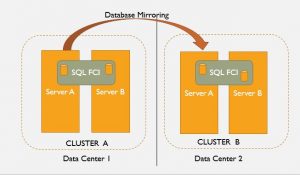
Sure, Database Mirroring (DBM) has been surpassed by its younger sibling Availability Groups, its full functionality reserved for Enterprise Edition, and it is marked as a deprecated feature. But it’s not dead yet. It’s still a valuable DR option (especially for Standard Edition) and it is an excellent tool for migration projects (hmm, perhaps it could be re-named as Database Migrationing). It’s so useful, I’m not sure MS will every actually get around to removing it and I, for one, hope it lives a long life. Just in case it does, here are a few DBM tricks, tips and hacks I’ve come up with…

(UPDATE: since writing the above I’ve read documentation that AOAG will be available in SQL2016 Standard Edition which is great news. But the limits on SE AOAG include 2 nodes only, non-readable secondaries, and one DB per availability group. DBM is also still available in 2016 SE, but now that the AOAG setup in SE is more or less just like a DBM session perhaps 2016 will be the final version including DBM).

Timeout

Your data is in Wonderland

When you configure the DBM partner via TSQL you have the option to explicitly set the timeout parameter. This is number of seconds the DBM session waits for a ping response from another partner (principal, witness or mirror) before going into panic mode. The default here is 10 seconds. If the DBM session is an HA solution –  “full safety” (synchronous) and auto-failover- then 10 seconds is the amount of time the servers can be out of contact before a failover is initiated. On the other hand, for a typical DR pair in “high performance“(asynchronous) mode, the databases will go in recovery or  disconnected status, depending on their role, principal or mirror, respectively.

It is pretty common to see TIMEOUT set as the default value. If the session is configured via SSMS, or even a TSQL statement that leaves out TIMEOUT, it’s going to be 10 seconds. This 10 seconds may be about right for a HA implementation, especially if you have a complete auto-failover set-up configured including a witness (which is the only correct way to do auto-failover) and some method to redirect the application connection as well as a high degree of confidence in the network. In short, if we know the partners will never be out of contact for more than 10 seconds, then this 10 second default could work.

But for an asynch DR implementation? Consider that for good DR the mirror instance is remote. This often means a less reliable network, more prone to a glitch or a dropped packet here and there. Also, remember that the DBM session continues pinging even after going into disconnected status. As soon as a ping returns from the partner server the database status’ can cycle back through synchronizing to synchronized. So, really a 10 seconds panic threshold is too sensitive for a DBM DR session in the real world.

It’s not a big deal to just go with the default. The impact is mostly limited to a ‘could not contact DBM partner’ type errors in the error log. But, with a more appropriate setting that error-log noise can be avoided. And we have a much better threshold to build an alert on. Even 60 seconds or more could be a reasonable configuration – i.e. in a DR configuration a 10 second network hiccup that the DBM session recovers from is probably not worth generating an alert, however a 60 second outage sure might be…

And so concludes the most words ever written about the database mirror timeout parameter.

Encryption

By default the database mirror traffic between partners is encrypted, but like the 10 second TIMEOUT, that default value (REQUIRED) might not be ideal. Read up on endpoint encryption here.  You could argue the impact of leaving the encryption enabled is negligible and that may be true, but, of course, part of a DBA’s job is to sweat the details. So, if encryption isn’t required it is worth considering turning it off, thereby improving throughput and gaining back those resources spent on encrypting\decrypting. YMMV. If you do go for it, check out this post from Remus R. which has pointers for making an on-the-fly change.

TDE

Since we’re on the topic of encryption here’s a thought on database mirroring and Transparent Data Encryption (TDE). It can be done, no doubt, but be careful combining these two features. In the real world, to stay on budget, it’s pretty common for the DR partner in a high performance mirror session to be somewhat under provisioned – i.e. less CPU, less RAM, slower disk, etc. Remember that TDE data is decrypted when it is read off the disk, and encrypted when written to the disk. Decrypt\encrypt operations may not be a problem for a well provisioned production server, but the DR partner server might be struggling as the mirror session is continuously streaming transaction log records on to disk and all those writes must be encrypted via CPU cycles. Even more so if the DR partner is not the same caliber hardware as the production server. Test the workload before implementation and keep an eye on the CPU use to be sure the DR partner can handle the extra encryption work.

Worker Threads

Back in the old days DBAs used to worry about how many databases could be mirrored per instance before performance issue started to show up. Consensus was no more than 10. That rule didn’t apply for long (SP1 iirc), but there is at least one good reason to keep an eye on how many DBM sessions are up and running. As already mentioned, it’s common to see under-provisioned DR servers. In this case, rather than CPU cycles we are considering worker threads since DBM process’ require several. It’s interesting that the mirror instance actually requires more worker threads than the principal. Here’s a good summary; “…database mirroring requires 2 threads on the principal server and at least 3 to 4 worker threads on the mirror server for each of the mirrored database in addition to 1 global thread on each of them. It is important to note that these calculations only reflect the number of worker threads required for administering database mirroring and additional threads are required for the core database server activity.”  So, keep the worker thread capacity of the mirror instance in mind. You may need to increase max thread count (via sp_configure), limit the DBM sessions, or use a higher caliber mirror server. This KB article (quoted above) details how to calculate thread counts per CPU and points out some other ‘Things to consider when setting up database mirroring in SQL Server’ (in fact that is the title).

Initialization

If you have worked with AOAG you might be familiar with the step in the setup wizard when you can initialize an AOAG replica with the push of a button (figuratively). I love that. Alas, DBM does not have an ‘Initialize’ button. But if you are lucky enough to have a situation where your principal server backs-up mirrored DBs to a shared remote location which the mirror instance can also access you can build something along those same lines. This makes mirror builds easy and avoids taking fresh, out of cycle backups to initialize a DBM session. The following utility script does just that. It iterates through the msdb..backupset table and generates TSQL to restore the most recent full backup on the mirror side. It also generates ordered restore statements to roll on diff and tlog backups from the file share. The output includes SET PARTNER statements to initialize the session on both principal and mirror instance and should be copied into and executed in a SQLCMD window so as to leverage the :CONNECT command. With some tweaking and some manual backup file copying it could be made to work for other scenarios where backups are local or are not on a shared disk. It’s nothing too fancy, but it has saved me time and hassle especially when faced with a project that requires many DBM session to be built in a short-as-possible time. P.S. Don’t forget to disable tlog backups while you are restoring the logs. Note the script is in 2 sections because of some limits of the formatting tool – i hope you don’t mind, I’m working on that problem.

declare @principal varchar(100) =
declare @mirror  varchar(100) =
declare @principalFQDN  varchar(100) =
declare @mirrorFQDN  varchar(100) =
declare @backupdir varchar(1000) =
declare @DB varchar(100) = 
declare @path  varchar(1000)
declare @SQL varchar(max)
declare @rowid  int, @cnt int
declare @output table
(SQLCMD)
create table #tempdbnames
(rowid int identity(1,1),
 dbname varchar(1000) 
)
insert into #tempdbnames
select db_name(database_id) from sys.databases where database_id > 4 and db_name(database_id) <> 'distribution' and db_name(database_id) like @db

select @cnt = COUNT(*) from  #tempdbnames
while @cnt <> 0
Begin
select @rowid = min(rowid) from #tempdbnames
select @DB = dbname from #tempdbnames where rowid = @rowid
create table #backups(
backup_start_date datetime,
type varchar(4),
physical_device_name varchar(1000),
text varchar(1000)
)
insert into #backups
select bs. backup_start_date, bs .type, mf.physical_device_name ,
'restore log ['+@DB +'] from disk = '+ ''''+ mf.physical_device_name +''' with norecovery, stats=10'
from msdb.. backupset bs
join msdb.. backupmediafamily mf
on bs. media_set_id = mf .media_set_id
where bs. database_name = @DB
and bs. type  = 'L'
and bs. backup_start_date >
(select max(backup_start_date ) from msdb..backupset bs
where bs. database_name = @DB
and bs. type  = 'I' )
and bs. backup_start_date >
(select max(backup_start_date ) from msdb..backupset bs
where bs. database_name = @DB
and bs. type  = 'D' )
union
select bs. backup_start_date, bs .type, mf.physical_device_name ,
'restore database [' +@DB+ '] from disk = '+ ''''+ mf.physical_device_name +''' with norecovery, stats=10'
from msdb.. backupset bs
join msdb.. backupmediafamily mf
on bs. media_set_id = mf .media_set_id
where bs. database_name = @DB
and bs. type  = 'I'
and bs. backup_start_date =
(select max(backup_start_date ) from msdb..backupset bs
where bs. database_name = @DB
and bs. type  = 'I' )
union
select bs. backup_start_date, bs .type, mf.physical_device_name ,
'restore database [' +@DB+ '] from disk = '+ ''''+ mf.physical_device_name +''' with norecovery, stats=10'
from msdb.. backupset bs
join msdb.. backupmediafamily mf
on bs. media_set_id = mf .media_set_id
where bs. database_name = @DB
and bs. type  = 'D'
and bs. backup_start_date =
(select max(backup_start_date ) from msdb..backupset bs
where bs. database_name = @DB
and bs. type  = 'D' )
order by bs.backup_start_date asc

…. but wait, there’s more …..

Set @SQL = ':Connect '+ @mirror +'
'
insert @output values(@SQL)

Select @path = physical_device_name from #backups where type = 'D'
Set @SQL = 'restore database '+@DB+' from disk = ''' + @path + ''' with replace, stats =10, norecovery --full
'
insert @output values(@SQL)
set @SQL = null
set @path = null
Select @path = physical_device_name from #backups where type = 'I'
if @path is not null
Begin
Set @SQL = 'restore database '+@DB+' from disk = ''' + @path + ''' with replace, stats =10, norecovery -diff
'
insert @output values(@SQL)
set @SQL = null
end

declare cx cursor for   
select physical_device_name from #backups where type = 'L'
open cx   
fetch next from cx into @path   
while @@FETCH_STATUS = 0   
begin
Set @SQL = 'restore log '+@DB+' from disk = ''' + @path + ''' with replace, stats =10, norecovery --log
'
insert @output values(@SQL)
set @SQL = null
fetch next from  cx into @path   
end 
close cx   
deallocate cx
Set @SQL =  'alter database ' + @DB + ' set partner = '''+@principalFQDN+'''
'
insert @output values(@SQL)

Set @SQL =  ':Connect '+@principal+'
'
insert @output values(@SQL)

Set @SQL =  'alter database ' + @DB + ' set partner = '''+@mirrorFQDN+'''
'
insert @output values(@SQL)

delete from #tempdbnames where dbname = @DB
select @cnt = COUNT(*) from  #tempdbnames
select * from @output
drop table #backups
end
drop table #tempdbnames

Migrations

Well I suppose most everyone knows this but I can’t help mention it because I think it’s interesting. Say you have a situation where the principal instance goes down and you want to bring the mirror instance DB online. A disconnected mirrored db has a status of recovering. Leaving aside all the details around lost data and split brains and so on, how do you simply bring the DB online?

RESTORE DATABASE [BLAUGH] WITH RECOVERY;

That’s it. No FROM DISK= , no ALTER DATABASE, no nothing but WITH RECOVERY. When the principal disconnects, the mirror instance is all synched up and transactionally consistent.  It’s the same situation when rolling on tlogs, if the final log is restored with no recovery, the DB just needs this last statement executed. This comes into play when doing migrations, in some cases rather than failing over the session, it can work just to disconnected the principal and run this command on the mirror DB to bring it online. All it needs is that one last RESTORE.

Partner

For a long time I considered the mirror session safety as a static setting; this DBM session is high-safety, that other one is high-performance, and so on. But struggling to keep the mirror session from getting too out of synch on a large DB during index rebuild made me start thinking of it more as a toggle switch. Turn on high-safety all production day long, switch to high-performance for nightly maintenance. Or conversely, depending on circumstances, you might find that operations that have high impact on mirror session latency can better be handled by using high-safety. This effectively guarantees the session cannot get out of synch (though it may require a longer maintenance window). So, there are a couple ways to think about it, and – assuming EE and no witness – it’s usually not a big deal to flip a session in or out of asynch and synch modes according to the need. Testing may reveal the best approach.

Po-boy’s Reporting\Testing DB

This last one is surely unsupported, but an interesting idea in my book and I actually implemented it for a time. If you need a quick copy of your DB on the mirror instance side, here is one way to do it:

  1. ensure the DBM session is synchronized (toggle high-safety)
  2. pause the session
  3. stop the mirror instance
  4. make a copy of the data and log file
  5. start the mirror instance and resume the DBM session
  6. attach the copied files as a new database to the mirrored instance

Viola, a secondary ‘snapshot’ readable copy of the mirrored DB on the mirror instance. As mentioned in the Migrations topic above, a synchronized database mirror is transactionally consistent, it just needs to be brought on line. Note, it’s been way back since SQL2005 since I tried this hack technique.  If you try it, please let me know how it goes ;).