VLFs: Very Large Flatabases (wait, what?)

Not everything is small in Flatland.

Remember that cool old book Flatland? Or maybe you saw the movie? Aside from the mashup title where I’m confounding VLFs and VLDBs this post has really not too much to do with Flatland (sorry). Except that, as you must know by now, I am a square.

I’m not the first square to post about virtual log files in the transaction log, but I’m guessing I won’t be the last either. So, with tons of credit to the SQL Skills crew (links below) where I picked up a good part of this, here’s my take on VLFs …

VLFs are logical management units within transaction log files – when a log file grows, it grows in VLF ‘blocks’, and when a log file truncates or shrinks, these operations also are applied to the file in blocks of VLFs. Additionally, during any database recovery operation (including cluster or mirror failovers, service restarts and database restores), each VLF within a t-log is examined to determine whether there are active transactions to roll forward. As you might imagine, an excessive number of VLFs can result in unnecessary overhead and delays in recovery time. Notice a DB that is taking an extra long time to come online after a service bounce? VLF count is the first things to check out.

Small values for a transaction log file auto-grow setting are the typical reason for too many VLFs. A good rule of thumb is that the auto-grow setting should be configured to generate VLFs of about 512 MB to 1 GB. Of course, the best solution is not to rely on auto-growth and manually size the transaction logs if and when you can. Either way, here is what you need to know to grow and\or set the auto-grow value.

SQL’s internal process to create VLFs follow these guidelines:

  • Growths of less than 64 MB and up to 64 MB generate 4 VLFs
  • Growths larger than 64 MB and up to 1 GB generate 8 VLFs
  • Growths larger than 1 GB generate 16 VLFs

Using these algorithms we can control a log file’s growth to achieve something close to the ideal 512 MB – 1 GB VLF size. In my experience the re-sizing process is usually part of a larger project to reduce VLF counts. The following steps outline the whole effort. This is a simple and effective way to get close to the file size and VLF count you want without getting lost in the minutia or splitting too many hairs.

This makes it easy:

  • Before you shrink the log file take note of the current size in MB, assuming this is the correct size, or make a note whatever the proposed new size should be.
  • Shrink, backup, repeat as necessary to minimize VLFs. This works best in a time of quiet so the log can clear easily. If there are many VLFs, quite a few transaction log backups may be required between each shrink since the shrink clears only the unused VLFs. Keep tabs on things as needed by noting the results of the DBCC Shinkfile.
  • Divide 8000 MB into the original size (or proposed new size), round up, and grow the log back that many times in multiples of 8000 MB (use 8000 MB b\c there is a bug in 4000 MB growth increments ). To explain, since each log file grow over 1 GB creates 16 VLFs, the 8000 MB grow results in approximate ideal VLF size of 512 MB.
  • For very large transaction log files – say over 240 GB – the growth statements can be issued in multiples of 16000 MB to create approximately 1 GB VLFs.
  • For smaller size logs –say less than 4 GB – a single growth statement is usually fine. Don’t pet the sweaty stuff.

Note, SQL 2014 has new rules around VLFs and file growths. The steps listed above still apply. It is a cool improvement. Check it out here:

Want to dig in? More VLF SQL Skills here :

Thank you for reading and happy shrinking\growing!

Right-sizing Multiple tempdb Files (or how I lost 30GB off my tempdev by following this one weird trick)

To follow up on my last post, here is a look at how to get the file sizing correct if\when it is determined that multiple tempdb files are a necessity. See that post for a discussion as to why multiple tempdb file might be needed. This post just concerns methods to get there… in this scenario we have a single tempdb data file and the challenge is to split it evenly into a number of same-sized files.  The post is in a Q&A format, so here we go…

Why would we need the same size tempdb data files?

Because of the way SQL decides which file to use for any given write. SQL uses a proportional fill method to evenly distribute writes across a set of data files within a filegroup. The files with the greater percent of free space get chosen for writes. Ideally this helps keeps a set of –let’s say- four files evenly filing up the file free space as SQL ‘round-robins’ it’s way through the files, selecting each as a write target in turn. It also ensure writes are distributed among the files and that no single file becomes a hot spot for writes.

SONY DSC

Not the Round Robin I meant.

However, this write-by-percent-free scenario can backfire. If one of the four files is mis-configured as significantly larger and has a larger percent for free space, that file gets the write every time (at least until the file free space percentages more or less match up, then it’s back to round-robin). In that case we may as well be back to only having a single data file since only one out of the four is getting writes. In fact, any file size or free space lop-sided-ness may inhibit the ideal round-robin write distributions. In the end, we really want evenly sized files (and, by the way, the same growth settings for each).

So, if you have one file and you need three more, just add three more files of the same size and let the proportional fill thing do its work, right?

Sure, that could work, but there is more to it…. let’s say our original tempdb data file (the mdf) is 40GB –  if we add 3 more evenly-sized files (the ndfs) – now we immediately have a 160GB tempdb! If we needed a larger tempdb anyway then that works out great, but it is not so great if tempdb is already appropriately sized.

It would be much easier if we could count on shrinking tempdb. Sticking to our example we might first shrink the tempdb data file to 10GB, then add three more ndf files at 10GB each. But it is not always so easy to shrink tempdb – especially if we have a very specific size in mind (10GB), and especially for a system with lots of tempdb use where the benefits of multiple tempdb files might be realized. In short, we do not want to just shrink the file to whatever, we want to re-size the file to particular size.

Let’s pause here and take a quick look at the toolset available to re-size SQL Server DB files.

  • DBCC SHIRINKFILE (<filename>,<filesize>) – the shrink file operation not only shrinks the file as much as possible, it also resets the data file size as you can see in the ‘size’ column if you query sys.database_files and\or sys.master_files like this:
select name, size/128 SizeMB  from <dbname>.sys.database_files where type_desc ='ROWS';
select name, size/128 SizeMB from sys.master_files where type_desc ='ROWS' ;
  • ALTER DATABASE <dbname> MODIFY FILE (NAME = <filename>, SIZE = <filesize>MB) –In contrast to DBCC SHRINKFILE, this option allows you to grow a file by resizing it. When you grow a file by this method, it behaves just like the DBCC SHRINKFILE command – the file size is reset to match the resize command. However, if you try to resize the file to a smaller size, you get an error:

MODIFY FILE failed. Specified size is less than or equal to current size.

And that’s the way it is for user files… but not for tempdb….

You mean to say that tempdb allows a DBA to alter a data file and re-size it smaller than the current size?

Yes. But not just that, we don’t have to apply the shrink immediately, we can defer the tempdb data file downsizing until the next sql service startup when the tempdb database file will be created new and at exactly the size we want.  This is actually explained in a KB here, but it is not very obvious.

Let’s try it:

Find the current size of tempdb mdf. For our running example this shows 40000MB (40GB)

select name, type_desc,size/128 SizeMB from tempdb.sys.database_files

Re-size to increase the file by 10GB

USE [master]

GO

ALTER DATABASE [tempdb] MODIFY FILE (NAME = N'tempdev', SIZE = 50000MB)

GO

Check the file size again – we should see 50000MB

select name, type_desc,size/128 SizeMB from tempdb.sys.database_files

Re-size to “shink” the file to 10GB

ALTER DATABASE [tempdb] MODIFY FILE (NAME = N'tempdev', SIZE = 10000MB)

Check the file size again. We should see 50000MB as if the alter statement failed…

select name, type_desc,size/128 SizeMB from tempdb.sys.database_files

…but if we look to sys.master_files to see our most recent modification we find the size is just what we asked for, 10000MB

select name, size/128 SizeMB from sys.master_files where type_desc ='ROWS' and database_id = 2

You will not see this same discrepancy if you use SSMS to size the files, its TSQL only. (Why? Because the TSQL modifies the tempdb ‘template’ in master, whereas the SSMS change attempts a DBCC ShrinkFile)

Interesting… So, how can we leverage this quirk of tempdb to solve the current issue – namely that we need to divide a single tempdb file evenly among several new tempdb files?

I’m glad you asked. There are two ways to go here; one is very hands-off but requires a bit of extra disk space on the tempdb drive, the other requires almost no additional space on the drive hosting tempdb beyond what tempdb is already taking, but will need to do some hands-on management after the sql service restart. Yep, sorry; to shrink and divvy up an existing single tempdb data file in to multiple evenly-sized files is going to require a restart. But wait, it might not be as bad as you think, read on….

Option 1: figure the current tempdb data file size and divide by the number of files which will ultimately be needed. This will be the files size of the new files. In our running example, we have a 40GB tempdb and we want 4 files. So we’ll add three 10GB files. This is where that extra disk space comes in – we need 30 free GB to create these files.

Then use the ALTER DATABASE command as described above to downsize the original mdf file to match the others. For our example we’ll re-size the file down from 40GB to 10GB. According to sys.database_files the mdf size is still 40GB, but the size in sys.master_files will be 10GB and that is the size the file will be created as when tempdb is created at start-up.

So now for the hands-off part; once this is set up (as long as no one tinkers with our size settings) we can walk away. The next service restart will re-create the mdf at 10GB and the 3 new ndfs at 10GB each for a total tempdb size of 40GB. Until then, writes will be distributed around the files, probably somewhat unevenly, but that should not do any harm and it is temporary. And once the sql service bounces per a planned maintenance, cluster failover, or whatever other reason, our multi-file tempdb will be in good shape.

Option 2: follow the same steps as option one here right up to sizing the 3 new files. In this case we just set all new ndf files to 1MB. Then “shrink” (re-size) the mdf as described.  Now we have three 1MB ndfs and one mdf of 40GB (but remember it is only 10GB according to sys.master_files). While we wait for the next service restart, writes will still mostly go to the mdf according to the proportional fill rules, so we haven’t really changed much of anything. After the reboot, we end up with a 10GB mdf file and 3 small 1MB ndf files which we can easily and quickly grow to match the mdf. Although arguably, it might be just as well to add and size the files after the service restart.

And finally, can you please tl;dr summarize?

To wrap it up: The tempdb database is a bit different when it comes to file sizing. In short this is because it is recreated on every start up and must look to the master database for its start-up configuration. Any tempdb file growth via ALTER DATABASE works like a user DB, i.e. the data file grows and new size becomes the initial start-up size. It’s the same for shrinks via DBCC SHRINKFILE – the shrink operation reduces the file size and the new size becomes the initial start-up size. Where tempdb differs is that it allows ALTER DATABASE command to re-size a data file to a smaller value, without actually changing the current file size. Instead, that new smaller value is held in master as the initial start-up size and leveraging this detail makes adding files to tempdb more precise and perhaps eases some of the hassles.

TempDB and Instance Standards

One of the ‘best practice’ practices I like to consider putting in place on a SQL instance is multiple tempdb files to eliminate any chance of tempdb allocation contention. Not that I’ve seen this allocation issue in the wild so much (although Paul Randal mentions it is pretty common in his experience), but having a couple-few, right-sized tempdb files a. doesn’t hurt, b. surely does help if there is a allocation issue, and 3. brings an instance into what I consider (for what its worth) a standard configuration. Like other what I’d call take-it-or-leave it configuration options (e.g. optimize for ad hoc workloads)*  sometimes its just as well to take-it since it at least indicates someone considered the whole picture of the server\instance and applied best practices.

Here is my version of a quick rundown to summarize the tempdb allocation issue: Every time that tempdb is used, the thread accessing tempdb must first find enough free space to build the temp object. It determines where it can locate this space by reading special pages – GAM, SGAM and PFS – which are evenly spaced throughout a database file. These pages serve as a kind of index to unused and available disk space. Every database has these pages, but tempdb is a special case since it is a shared resource which potentially any and every user may utilize. Herein lies the trouble; a bottleneck can develop when many threads need tempdb space and so require latches on these special pages.

The resolution is simply to distribute the load by adding more tempdb files. If the need for multiple tempdb files is evident, the current suggestion is 1 file per 1 logical CPU up to 8 logical CPUs, then, if contentions still exists, add 4 files at a time (up to the count of logical CPUs). All files should be the same size because this will allow SQL’s proportional fill algorithm to evenly allocate space in the files. Careful now –  if there are too many files this can be a performance problem as well since sort memory spills may spend extra time doing round robin allocations among many tempdb file. Note: trace flag 1118 forces all db allocations, system wide, to be in extents (not pages) and so is an option to specifically reduce contention on SGAM pages, including (but not limited to) tempdb SGAM pages.

So, how do you know if an instance has this kinda thing going on? Check out the query in this blog post Robert L Davis aka SQL Soldier or look back on the query in the SQL Skills post mentioned above. Both use sys.dm_os_waiting_tasks to ‘catch’  tempdb PAGEIOLATCH_ % waits red-handed. Pretty cool, but one draw back is that you have to go looking for these waits – polling the waiting tasks every-so-often. If you’d rather just sit back and let those waits come to you – so to speak – check out Kehayias’ SimpleTalk article ‘Optimizing tempdb configuration with SQL Server 2012 Extended Events’. Yeah, I know, SFA, next level cool.

Well, this post sort of turned into a reference of links on the tempdb allocation contention issue. Lets throw in one more for good measure. This is Adam Mechanics explanation in the context of his sp_whoisactive tool.

But anyway, getting back to the original point – what do you think friendly blog reader? (hi mom). Is there a set of ‘standard’ configurations you like to put in place on an instance? Perhaps regardless of whether or not their implementation is ‘proven’ as necessary?  Or is it just as well to manage a distinct set of configuration options for each instance? If you have instances that are less used or non-production is it worth the effort to standardize them? Or is it better to stamp every instance out of the same template regardless of use? If not, where\how do you draw the line between ‘must adhere to standards’ instances and ‘no big deal’ instances?

*take-it-or-leave-it configuration – some instance \ database configuration that wont hurt and may or may not help.

Fear, getting worked, and Eskimo rolls

About this time last year I was on a river trip. Some friends had lucked into a permit for the Main Fork of the Salmon in Idaho. The Main Fork of the Salmon is a designated Wild and Scenic River and, for anybody who loves wilderness, rivers and white water, the Salmon is surely on their bucket-list. I got clearance from the home-front for the 9 day trip – a couple days of travel and 7 days\6 nights floating the 80 miles of river and camping on the beaches –  and jumped at the opportunity.  Most in the group of my friends planned on oaring their rafts. I had an old whitewater kayak collecting dust in the garage, so rather than riding shotgun in someone else’s rig, I planned to dust off my Eskimo roll and paddle the class 3 rapids.

salmon

Main Salmon River

About this time last month, I presented ‘Top 10 Issues Identified by SQL Health Checks’ on back-to-back nights for SQL Server User Groups in Toledo and Detroit.

How are these apparently disparate events related?

After pushing off the beach in the Salmon we ran a few easy rapids, but then the water slowed and pooled up as the river got ready to drop through the first section of class 3 water. As I approached the tongue of the rapid I could see bright white splashes of white water jumping above the river’s horizon-line – I began to have some serious doubts about what I was getting into… In case I gave you the wrong impression about my kayak skills, let me explain that – aside from one day of practice on the Colorado River – the last time I paddled was about 10 years ago, and I was no too good at it back then. Like riding a bike, you never really completely loose paddling skills you do have, but they sure do atrophy!

The last time I spoke publicly was also about 10 years ago – but that was on the topic of deep ecology for my environmental science classmates as part of a senior assignment – an easy crowd.

On the river – approaching what basically looked like a small waterfall – I had these feelings of fear. I even turned around and began paddling back up river with the hope of catching a ride on one of the rafts. But it was way too late for that (the Salmon is known as The River of No Return), I was already committed. I had to face it. Deep breath. Lean forward. Get lined up … and ….Paddle!

It went great for the first couple moves. And then I missed a brace and I went over. And … I. Got. W.O.R.K.E.D! A trip to the laundry-mat.

I managed a roll and came upright – still mid-rapid – facing up river looking at the treed steep slopes of the canyon, the blue sky, and the mirror-still pool above the white-water cascade. And I.Was.Totally.Stoked! The mental snapshot of that time and place and feeling I will never forget.

Speaking at the Toledo and Detroit SQL Server User Groups was not quite the same caliber of drama and adventure surrounded by nature’s beauty. But I did have the same fear, the same no-going-back commitment, the same deep breath….

IMG_6234

And… well… heh heh…  I.Got.WORKED – at some points it sure felt like that.

In fact both presentations went fairly well. I got some ‘goods’ and a few ‘excellents’, but there is also a good sampling of ‘fair’ and ‘poor’ boxes checked in the evaluation forms from the events. The standards are high. These are Professional Association of SQL Server (PASS) User Groups so this is Class 3 speaking after all. A little more prep time, a little more speaking experience — I think I know I could do better. To cut myself a little slack though, I did get through the irrational fear of it all and broke the seal, My next time presenting won’t be my first time presenting (and next time is coming up pretty quickly)

And now I’m stoked! I had a chance to meet some very nice people in both cities. Much thanks to the organizers and attendees. (I even had a beer with MVP Jeff – RBAR – Moden). I’m attending my local PASS meetings (after too long away) and I hope to present there soon. I’ll be at the local toast masters meetup next month to work on this speaking skill. I’m signed up for some multi-day SQL training early next year to keep improving those skills. And, as part of a new job role, I’ll be presenting at IT Dev Connections in Las Vegas in September.

As for kayaking, there is an upcoming weekend class I hope to attend.

So, cheers! Keep the fun side up, and here is to facing your fears – even when you get worked!

P.S. I haven’t written here in a while, but I have been posting over at my company’s blog   on The Data Collector, Hekaton, and other topics.


T-SQL Tuesday #46 : Table Partitioning to Archive

TT150x150_thumb

This is my first T-SQL Tuesday post. Thanks to Rick Krueger (blog)  for hosting.

On hearing this month’s subject I googled around a bit for the ‘official’ definition of a Rube Goldberg Machine. Wikipedia  has it as  “…a deliberately over-engineered or overdone machine that performs a very simple task in a very complex fashion, usually including a chain reaction.” I guess I’m not the only one this Tuesday who ran across this video from OK Go which is an entertaining example.

If you are at all like me (read DBA nerd), you tend to see any block-like units from legos to shipping containers as somehow representing values in the all-encompassing, cosmic database schema of reality (there is one right?). So perhaps you’ll understand how the first scene of the video -the falling dominoes – as well as the ‘chain reaction’ in the wikipedia definition got me thinking about table partitioning. More specifically, a sliding-window type implementation of table partitioning I once configured to age-out\ roll-off older date-based data from an active oltp table into a sibling report table and so enforcing some segregation of conflicting query types.

Of course, there are a number of simple ways to age-out old data (e.g. TSQL insert\delete, SSIS, etc) and table partitioning may be more typically thought of as a complex solution applied to large data-sets and enterprise infrastructure. Depending on the situation, table partitioning just might be overkill … Rube Goldberg indeed. However, several features of table partitioning really may make it an neat solution regardless of the size of the data and hopefully the following examples will bring them to light.

At this point I want to mention that table partitioning is an enterprise feature. Also, thanks to Kendra Little and her post here – those ‘helper views’ are definitely helpful.

Gathering the material and building the contraption:

Example Tables:

This is our table of date-based data, product.

CREATE TABLE product (
asofdate datetime2, descr varchar(100)
)

And here we populate it with records for every minute of every hour for the last 24 hours (I chose to partition by the hour for this post but it could be any unit of time). In the real world there could be any number of records for any hour but to keep it simple for this example each hours-worth of data will have 60 rows.

DECLARE @start datetime2 = DATEADD(d,-1,SYSDATETIME())
DECLARE @inc int = 1439

INSERT INTO product
VALUES (@start,cast(CRYPT_GEN_RANDOM(50) as varchar(100)))

WHILE @inc > 0
BEGIN
INSERT INTO product
SELECT TOP 1 DATEADD(MI, @inc, asofdate),
CAST(CRYPT_GEN_RANDOM(50) as varchar(100))
FROM product order by asofdate 
SELECT @inc = @inc-1
END

As each hour goes by, the oldest data in the product table become 25 hours old. This is the data we wish to age-out and roll off to an archive table.

CREATE TABLE archive (
asofdate datetime2, descr varchar(100)
)

Partition Functions:

Next, we need two partition functions, one for each table.

For the product table we start with a single range value 25 hours prior to the last date in the product table to set an initial boundary.

DECLARE @StartHour datetime2 = DATEADD(hh,-25,(SELECT MAX(asofdate) FROM product));
CREATE PARTITION FUNCTION product_pf (datetime2)
AS RANGE RIGHT FOR VALUES (@StartHour);
GO

I find visualizing the partition ranges is very helpful — here is simple text diagram to illustrate the range values of the partition function at this point. The bar represents the boundary (aka range value) and the number represents the the hours since the newest value in the product table, i.e the hours-old.

older than 25 | 25 and newer

Next we loop a split operation to create range values (i.e. boundaries) for each hour of the day to build the partiton function into something like this …

older | 25 | 24 | 23 | … | 2 | 1 | newer

DECLARE @StartHour datetime2 = DATEADD(hh,-24,(SELECT MAX(asofdate) FROM product));
DECLARE @i int =0
WHILE @i<>25
BEGIN
ALTER PARTITION FUNCTION product_PF() 
SPLIT RANGE (DATEADD(hh,@i,@StartHour));
SET @i=@i+1
END

We can examine our partition function to be sure it has the range values we want …

SELECT pf.name, rv.boundary_id, rv.value, 
DATEDIFF(hh,convert(datetime2,rv.value),(SELECT MAX(asofdate) FROM product)) AS 'HoursOld'
FROM sys.partition_range_values rv
JOIN sys.partition_functions pf 
ON rv.function_id = pf.function_id
WHERE pf.name = 'product_PF'

….and we can add another – or another few – as needed. There is no harm, and in fact you are building in a margin of safety for later split operations, if you create extra boundaries on the leading end.

older | 25 | 24 | 23 | … | 2 | 1 | 0 | -1 | -2 | newer

--find the max range value 
DECLARE @maxpartbound datetime2
SELECT @maxpartbound = CAST(MAX(value) as datetime2)
FROM sys.partition_range_values rv
JOIN sys.partition_functions pf 
ON rv.function_id = pf.function_id
WHERE pf.name = 'product_pf'

--add a hour to the max range value and split off a new range
ALTER PARTITION FUNCTION product_pf() 
SPLIT RANGE (DATEADD(hh,1,@maxpartbound))

For the archive table we initially only need 2 range values to define the boundary between data which is 23 hours old (and newer), 24 hour old data, and data older than 24 hours.

older than 24 | 24 | 23 and newer

As you will see, once we apply this function to the archive table the partition housing the 24-hour-old data will always be empty since that data is still part of the product table, however it needs to be there as a place-holder when the 24-hour-old data turns 25.

DECLARE @StartHour datetime2=DATEADD(hh,-24,getdate());
CREATE PARTITION FUNCTION archive_pf (datetime2)
AS RANGE RIGHT FOR VALUES
(@StartHour);

Partition Scheme:

We require two partition schemes – one for each partition function. In short, the partition scheme maps each table partition to a file group, ideally so as to spread the IO across multiple disks. Although it might be nice, in this scenario where we are solely focusing on an archiving solution, we don’t necessarily need multiple disks, we need a simple, efficient, repeatable archive process. When this came to light for me I was very excited since it simplifies things to a large degree and makes this otherwise complex feature a Rube Goldberg viable solution. The partition schemes will map all partitions to the primary filegroup.

--create the product partition scheme
CREATE PARTITION SCHEME product_ps 
AS PARTITION product_pf
ALL TO ([PRIMARY]);

--create the archive partition scheme
CREATE PARTITION SCHEME archive_ps 
AS PARTITION archive_pf
ALL TO ( [PRIMARY] );

Indexes:

Lastly we need two clustered indexes – one for each table. Building the cluster index on the table using the partition scheme effectively applies the partitioning to the table.

CREATE CLUSTERED INDEX [cix_product-asofdate]
ON product(asofdate ASC ) 
ON product_ps(asofdate)

CREATE CLUSTERED INDEX [cix_archive-asofdate] 
ON archive(asofdate ASC )
ON archive_ps(asofdate)

Tipping the domino:

As each hour passes the oldest data in the product table becomes eligible for archival. To archive that partition we’ll alter the partition functions to split off new boundaries or merge old ones and use the switch argument of the alter table command.

As a point of reference here is a diagram of the usual, between-the-hours state of partitioning in the system. This is T1.

T1

T1 – Standard configuration

At T2 the oldest data in the product table is 25 hours old and ready to be moved to the archive table. 

T2

T2 – At the turn of the hour

This is the time to initiate the archive process beginning with the switch.

Switch:

T3

Post switch

To run the switch we need a source and target partition number from the product and archive tables. We can get that via a partition function but first we need the minimum range values of the product table’s partitions. While we’re at it we can also grab the minimum range values of the archive tables partitions which we’ll use later for the merge.

--find the min archive boundry -will use it to merge later
DECLARE @MinArchiveBoundry DATETIME2(0);
SELECT @MinArchiveBoundry = CAST(MIN(rv.value) AS DATETIME2(0))
FROM sys.partition_functions  pf
JOIN sys.partition_range_values rv 
ON pf.function_id=rv.function_id
where pf.name='archive_pf'

--find the minimum range partition in product so we can pass it to the $PARTITION function
DECLARE @MinProductBoundry DATETIME2(0);
SELECT @MinProductBoundry = CAST(MIN(rv.value) AS DATETIME2(0))
FROM sys.partition_functions  pf
JOIN sys.partition_range_values rv 
ON pf.function_id=rv.function_id
where pf.name='product_pf'

--use $PARTITION function to figure the correct partition numbers based on the minimum range val in product table
declare @ProductPartitionToArchive int, @ArchivePartition int
select @ProductPartitionToArchive =$PARTITION.product_pf(@MinProductBoundry)
select @ArchivePartition =$PARTITION.archive_pf(@MinProductBoundry)

--switch details to archive
ALTER TABLE product SWITCH PARTITION @DetailPartitionToArchive  TO archive PARTITION @ArchivePartition;

 Merge:

T4

Before merge

Using the same variables we set as minimum range values during the switch we can merge the trailing partitions of each table.

--merge archive trailing partitions
ALTER PARTITION FUNCTION archive_pf() MERGE RANGE (@MinArchiveBoundry);

--merge detail tail ends
ALTER PARTITION FUNCTION detail_pf() MERGE RANGE (@MinDetailBoundry);

T5

Post merge

Split:

T6

Pre split at T6

It is expensive to split a partition containing data since it results in disk IO so we always want to split empty partitions. Since we lost a partition boundary in the merge, the last step of the archive process is to split a new partition range off the leading (and empty) end of each table. This results in an empty place holder partition and prepares the table for the next switch-merge-split. Note the ALTER PARTITION SCHEME call here which would normally set the next file group – in our case its not necessary since all partitions are on the primary file group but I have included it.

--split off some new empty future partitions
ALTER PARTITION SCHEME archive_ps NEXT USED [PRIMARY]
--find the most recent boundary
 DECLARE @MaxArchiveBoundry DATETIME2(0);
SELECT @MaxArchiveBoundry = CAST(MAX(rv.value) AS DATETIME2(0))
FROM sys.partition_functions  pf
JOIN sys.partition_range_values rv 
ON pf.function_id=rv.function_id
where pf.name='archive_pf'
--add one hour to the most recent boundary and split the partition
ALTER PARTITION FUNCTION archive_pf() 
SPLIT RANGE (DATEADD(hh,1,CAST(@MaxArchiveBoundry AS DATETIME2)))

ALTER PARTITION SCHEME product_ps NEXT USED [PRIMARY]
--find the most recent boundary
DECLARE @MaxProductBoundry DATETIME2(0);
SELECT @MaxProductBoundry = CAST(MAX(rv.value) AS DATETIME2(0))
FROM sys.partition_functions  pf
JOIN sys.partition_range_values rv 
ON pf.function_id=rv.function_id
where pf.name='product_pf'
--add one hour to the most recent boundary and split the partition
ALTER PARTITION FUNCTION product_pf() 
SPLIT RANGE (DATEADD(hh,1,CAST(@MaxProductBoundry AS DATETIME2)))

At T7 the split has been applied to both partitioned tables and we’ve come full circle back to the standard operating configuration.

T7


Well, there you have it…

…a walk through and working example of a simple data archive solution using table partitioning and a Rube Goldberg contraption in its own right.

If only I had just a little more time I’d put a trigger on the archive table that inserted a row to another table where the insert fires-off a service broker message that runs a procedure which fails-over a mirror session which generates an alert which cause a job to run which …..  …. a yoga-ball which turns on the coffee maker which kicks-off sp_send_dbmail and finally, finally, finally sends you an email to say…..

“Thank you for reading my post!”


Overview: SQL Database Mirroring High-Availability with Automatic-Failover

A High-Availability with Automatic-Failover SQL Database Mirroring Configuration consists of a Principal Instance and Database, a Mirror Instance and Database, and a Witness Instance.  Each instance must have a Database Mirror Endpoint – a special TCPIP endpoint with defined listener IP and port. A mirroring session is configured between these servers utilizing the dedicated mirror endpoints.

A ‘ping’ request bounces around between the 3 servers as a ‘heart-beat’ or ‘is-alive’ type of check.  Given a failure of the ‘is-alive’ test any 2 servers still communicating can form a quorum.  In the case where the quorum members are the Mirror Instance and the Witness Instance these two instances can agree to automatically fail-over the mirror session so that the Mirror Instance becomes the ‘new’ Principal Instance.

The following outline and accompanying diagram illustrates the transaction flow in a High Availability with Automatic Failover SQL Data Mirror Configuration:

synch DBM diagram 

  1. Transactions execute against a mirrored database on the Principal Instance
  2. Before the transactions are written to the transaction log, they persist in the log-buffer memory space and here is where Database Mirroring picks them up.  The transactions remain here – unhardened – until the mirror process completes.
  3. The transaction data is sent over the wire to the Mirror Instance via the Database Mirror Endpoint.
  4. The transactions land in the Mirror Instance log buffer and …
  5. … are hardened to the Mirror Instance Transaction Log.
  6. An acknowledgement message that the transaction is committed to the Mirror SQL Instance t-log is sent to the Principal SQL Instance. Also, the transactions are applied to the Mirror Database as the Mirror Instance Transaction Log is continuously restored to the Mirror Database.
  7. Finally, once the ‘ACK’ that the transaction is hardened on the Mirror Instance, the transaction is written to the Principal Instance T-log.

Chasing Down Errors in the Management Data Warehouse Disk Usage Collection Set Report

If you use Management Data Warehouse and the accompanying SSRS reports you might have already noticed the issues with the Disk Usage Collection Set Reports. It is spelled out here – http://social.msdn.microsoft.com/Forums/en-US/sqlkjmanageability/thread/5af56ba9-0ef0-4609-9a23-6da2f59bb266/ – but in summary if you click on the Database Trend line, the graph you see shows you a total database size approximately twice as big as the actual file size. Furthermore, the series fields on the graph – data, reserved, unused and index – don’t really make sense and examining the table view of the data enforces this feeling: Why is Data Size itself as big as the database’s physical data file? Why would Data Size and Unused Size be close the same value? Why are the Unallocated Size and Unused Size values static over time through the entire 100 samples?

In this screen shot from an example database you can see all these issues. The graph reports data size near twice as big as the physical file, a relatively large and suspicious ‘Unused Size’ as well as static values for ‘Unallocated Size’ field.

file vs graph

Obviously, there is more going on here than any clever interpretation of the data or graph can account for… in fact – as I discovered- it is just plain wrong. I dug a little deeper into the data and process underlying the report to figure out why and this post describes what I found out.

Chasing Rabbits:

To begin with let’s review the terms and layout of database disk usage with a review of the old standby sp_spaceused.  Per BOL this proc – when run against a database – returns both summary and detailed results–

Summary

  • database_name:               Name of the current database.
  • database_size:                  Size of the current database in megabytes. database_size includes both data and log files.
  • unallocated space:           Space in the database that has not been reserved for database objects.

Details

  • Reserved:            Total amount of space allocated by objects in the database.
  • Data:                    Total amount of space used by data.
  • Index_size:          Total amount of space used by indexes.
  • Unused:               Total amount of space reserved for objects in the database, but not yet  used.

Here we have the general usage-type building blocks that make up a data file (or files) and the layout can be envisioned as something like this–

DFS

…with the Data, Index and Unused blocks summing up to the Reserved size and the remaining ‘free-space’ in the file termed Unallocated.

For the example database shown above sp_spaceused returns–

sp_spaceused MB
database_size 570473
unallocated space 30903.91
data 255669.368*
index_size 185424.8*
unused 2601.024*
reserved 443695.192*

*converted from KB

So – as we suspected- we do not have much of a match up with the Disk Usage Collector report and sp_spaceused for the same database.

One drawback of the MDW SSRS reports is that the RDL is not accessible – it is wrapped up in the SSRS application and cannot be viewed or modified. So, the next steps in identifying where the report goes awry is to check in on the source data for the report – working back from the MDW table to the data collector. Running a profiler trace against the MDW DB while executing the report shows the underlying query to be this—

DECLARE @snapshot_id int

SELECT TOP 1 @snapshot_id = snapshot_id FROM (
SELECT DISTINCT TOP 100 d.snapshot_id
FROM snapshots.disk_usage d, core.snapshots ss
WHERE ss.instance_name = @ServerName
AND ss.snapshot_id = d.snapshot_id
ORDER BY d.snapshot_id DESC
) AS q
ORDER BY snapshot_id ASC

DECLARE @unallocated_space_mb float
DECLARE @reserved_mb float

SELECT   @reserved_mb=(d.reservedpages * 8192 / 1048576.0),
@unallocated_space_mb=(
case
when d.dbsize >= d.reservedpages
then (convert (dec (15,2),d.dbsize) - convert (dec (15,2),d.reservedpages)) * 8192 / 1048576.0
else 0
end)
FROM snapshots.disk_usage d, core.snapshots ss
WHERE d.database_name=@SelectedDatabaseName
AND ss.instance_name = @ServerName
AND d.snapshot_id = ss.snapshot_id

SELECT
CONVERT (datetime, SWITCHOFFSET (CAST (d.collection_time AS datetimeoffset), '+00:00')) AS collection_time,
d.snapshot_id,
((convert(dec (15,2),d.dbsize) + convert(dec(15,2),d.logsize)) * 8192 / 1048576.0) AS 'database_size_mb',
@reserved_mb AS 'reserved_mb',
@unallocated_space_mb AS 'unallocated_space_mb',
((d.usedpages - d.pages) * 8192 / 1048576.0) AS 'index_mb'
FROM snapshots.disk_usage d, core.snapshots ss
WHERE database_name=@SelectedDatabaseName
AND d.snapshot_id >= @snapshot_id
AND ss.instance_name = @ServerName
AND d.snapshot_id = ss.snapshot_id
ORDER BY collection_time

The most important thing to note here is the source table snapshots.disk_usage since we’ll need to check that data out. However, just a quick overview of this query brings a few issues to light. If you break the query down into its three component SELECT-FROM statements you get this analysis—

  1. Sets @snapshot_id to the most recent 100th record (for this DB and instance)
  2. Sets @reserved_mb and @unallocated_space_mb to the values in the most recent 100th record
  3. Returns collection_time, database_size_mb, reserved_mb, unallocated_space_mb and index_mb

Interesting: reserved_mb, unallocated_space_mb should change over time but since they are selected from the variables @reserved_mb and @unallocated_space_mb they will be static for each row. Also to note, the database_size_mb field sums data and log file size similarly to the sp_spacedused proc results. This looks correct in itself, but going back to the report the graph illustrates ‘Data Size’ which would seem to indicate data only. Something is just not right here… For comparison with sp_spaceused this is the top result for our example DB–

MDW Report MB
database_size_mb 570473
reserved_mb 433156.62
unallocated_space_mb 31043.383
index_mb 181004.77

…and to illustrate the mis-mapped fields (like the database_size_mb = ‘Data Size’ mentioned above but also including reserved_mb = ‘Unused Size’), here is how these results end up transferring to the report—

MDW disk 2

To continue to chase this rabbit, here is a sample of the data direct from the MDW source table snapshots.disk_usage –

snapshots.disk_usage value
dbsize 59417600
logsize 16216192
ftsize 0
reservedpages 55493987
usedpages 55148908
pages 31941867
database_name Example
collection_time 2013-06-03 17:00:24.0000000 +00:00
snapshot_id 178238

According to the BOL entry for System Data Collection Sets here- http://technet.microsoft.com/en-us/library/bb964725(v=sql.105).aspx -we can see what query the data collector is running. Then, referring to the BOL entries for the system catalogues the query uses, we can figure the meaning of each field–

  • dbsize — size from sys.database_files
  • logsize — size from sys.database_files
  • ftsize: — size from sys.database_files
  • reserved: — total_pages from sys.allocation_units –Total number of pages allocated or reserved by this allocation unit.
  • used: — used_pages from sys.allocation_units — Number of total pages actually in use.
  • pages: — from sys.allocation_units — Number of used pages that have In-row data, LOB data or Row-overflow data (value returned excludes internal index pages and allocation-management pages). Excludes xml_index_nodes and fulltext_catalog_map. When LOB or Row-overflow data then number of total pages actually in use (used_pages), when Heap or Clustered then In-row data pages (data_pages). In short, purely data excluding indexes.

So, the data collector query seems to align fairly closely with sp_spaceused used, showing some summary DB info (but with distinct database and log values) as well as details on the ‘allocated’ portion of the file. In fact we can translate the data collector query results into sp_spaceused results like this—

  • database_size = dbsize + logsize
  • unallocated space = dbsize – reserved
  • data = pages
  • index_size = used – pages
  • unused = reserved – used
  • reserved = reserved

…and, if we refer to the data collector data for our example database, we can see the data matched up reasonably well (give-or-take due to a number of factors including the time of the samples). Let’s see them side-by-side—

data collector query MB*   sp_spaceused MB
dbsize 464200 database_size 570473
logsize 106273 unallocated space 30903.91
ftsize 0 data 255669.368
reserved 433296.52 index_size 185424.8
used 430756.48 unused 2601.024
pages 249677.59 reserved 443695.192

*converted from pages

Climbing back out of the rabbit hole:

Back to the report – it would seem likely that the report is meant to show a version of sp_spaceused but somewhere the wires were crossed and terminology confused. We know from this investigation that the data collector and the MWD table it populates are A.O.K- the data there is good. The trouble begins with the query the report issues against the MDW database. Here is a version of that query as it could be – returning from snapshots.disk_usage the top most recent 100 records for collection_time, database_size_mb, reserved_mb, unallocated_space_mb and index_mb as well as the missing piece – data_mb

DECLARE @ServerName varchar(max)
DECLARE @SelectedDatabaseName varchar(max)
DECLARE @snapshot_id int

SELECT TOP 1 @snapshot_id = snapshot_id FROM (

SELECT DISTINCT TOP 100 d.snapshot_id
FROM snapshots.disk_usage d, core.snapshots ss
WHERE ss.instance_name = @ServerName
AND ss.snapshot_id = d.snapshot_id
ORDER BY d.snapshot_id DESC
) AS q
ORDER BY snapshot_id ASC
SELECT
database_name,
CONVERT (datetime, SWITCHOFFSET (CAST (d.collection_time AS datetimeoffset), '+00:00')) AS collection_time,
d.snapshot_id,
((convert(dec (15,2),d.dbsize) + convert(dec(15,2),d.logsize)) * 8192 / 1048576.0) AS 'database_size_mb',
'reserved_mb' = (d.reservedpages * 8192 / 1048576.0),
'data_mb' = convert(dec(15,2),d.pages) * 8192 / 1048576.0,
'index_mb'= (d.usedpages - d.pages) * 8192 / 1048576.0,
'unused_mb' = ((convert(dec (15,2),d.reservedpages) - convert(dec(15,2),d.usedpages)) * 8192 / 1048576.0),
'unallocated_space_mb' = (
case
when d.dbsize >= d.reservedpages
then (convert (dec (15,2),d.dbsize) - convert (dec (15,2),d.reservedpages)) * 8192 / 1048576.0
else 0
end)
FROM snapshots.disk_usage d, core.snapshots ss
WHERE database_name =@SelectedDatabaseName
AND d.snapshot_id >= @snapshot_id
AND ss.instance_name = @ServerName
AND d.snapshot_id = ss.snapshot_id
ORDER BY collection_time asc

Using this data the report can be corrected to show the trends of disk use for a given database. We can put the data in excel and create a graph similar to the SSRS report that actually correlates with the observed data file size—

excel graph

Unfortunately, it does not look like Microsoft will be fixing this report anytime soon (in fact SQL2012 still has some of these issues) and – as mentioned – there is no way to modify and correct the RDL code. That being said, the underlying data in the MDW database (in this case and as a whole) is correct, clean, and includes many interesting metrics. Given some of the limitations (or misinformation in this case) of the SSRS MDW reports it is worth taking a look into alternate ways to collect and deliver the MDW data. I hope to take a look at this idea in future posts.


Pluralsight Training

I’ve been interested in the virtual training published at Pluralsight for a few months and missed a few opportunities for discounted or free presentation viewings. Finally I was curious enough that I signed up for the free trial which offers 200 min or 10 days of content.  I’m most of the way though Paul Randal’s “Communications: How to Talk, Write, Present, and Get Ahead!”.  I’ll follow up with a review style post (perhaps after I finish the “How to Write Blog Posts” module),  but so far so good. I imagine I will let my free trial roll over into a monthly subscription and start consuming the technical content.

Testing the BUFFERCOUNT Argument

I wanted to check out the ideas presented by the SQLCAT team here to tune backup processes: Tuning the Performance of Backup Compression in SQL Server 2008

To follow along with the suggested trials, I took a series of backups of a ~50GB database on a test instance and captured duration, backup thru-put and CPU to narrow down optimal backup parameters. The test instance I used is SS2008 64-bit EE running on a Win2008 box with 148GB RAM and 64 CPU. I used perfmon counters to capture thru-put and % processor time and noted the backup results to capture the durations

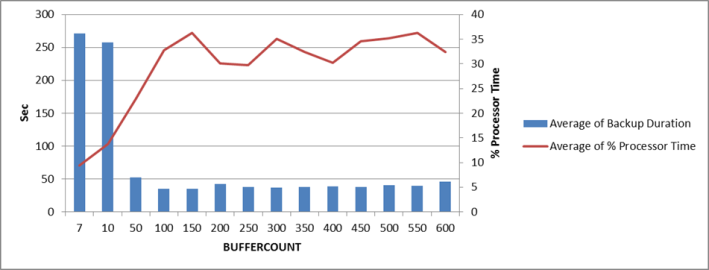
According to the suggestions I ran a backup to disk=’nul’ for buffercounts 50 through 600 and including the baseline default of 7. This highlights what might be the optimal buffercount to increase backup speed without unduly taxing the CPU.

As you can see, duration improves significantly with non-default buffer counts:

Image

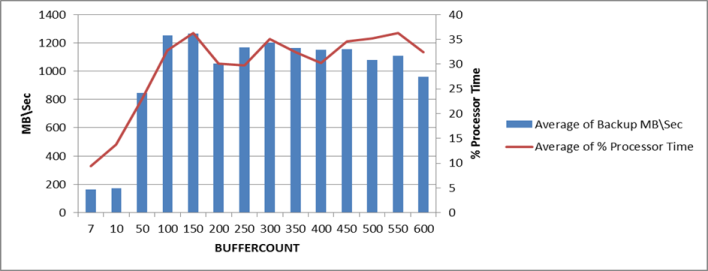
Also, not surprisingly, throughput increases correspondingly:

Image

Of course the speed and throughput are at the cost of CPU time, however there is an apparent sweet-spot here at buffercount ~100 which gives us the best performance with the least cost. Higher buffercounts do not seem to offer further improvements.

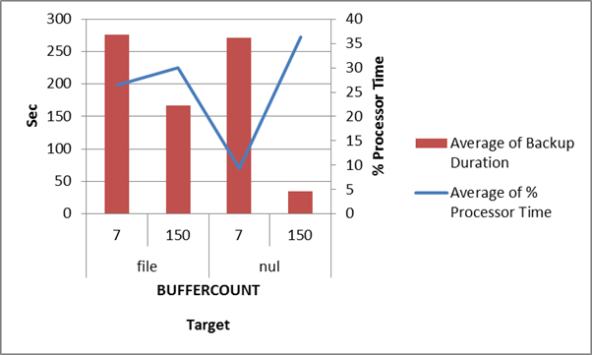
So, accepting a buffercount of 100-150 is the optimal setting, I proceeded to run a few tests writing the backups to the actual file share used.  As suggested might be the case by the SQL CAT team, writing the backup to file is indeed the limiting factor in speeding up backups. However, considering the baseline default buffer count (7) vs a buffer count of 100-150 we might still realize a significant performance increase in backup speeds.

ImageImage

Using these findings I was able to convince my team to implement buffercount = 100 for the standard backup jobs and decreased backup duration for several key instances. More importantly, the DBA team now utilizes the buffercount argument when replication teardownrebuilds are required for some time-critical project work and the replication is (re)built using initialize-via-backup methods.